
Sales data is in for September, and it doesn’t look good. Well, for the sellers anyway.
Totals for (Berg, Es, Hud, Mid, Mor, Pas, Som, Sus, Un, War)
June – 3590
July – 3716
August – 3791
September – 3223
Just a side note, this numbers do include the Middlesex numbers, so if you are looking to calculate DOM using sales (remember its a lagging indicator), and the current inventory numbers the number you want to use for this month is 3108 (which comes in around 4 months). However, sales are on a downtrend into the winter slump, and listings are skyrocketing. Also, keep in mind these are gsmls numbers only, they don’t include njmls or fsbo sales. This is useful for trending, but you shouldn’t treat these numbers as gold. Also again, I can’t stress this enough, sales data is lagging, what we are seeing now are closed sales that went under contract months ago. So this data really applies to parts of June, July, and August.
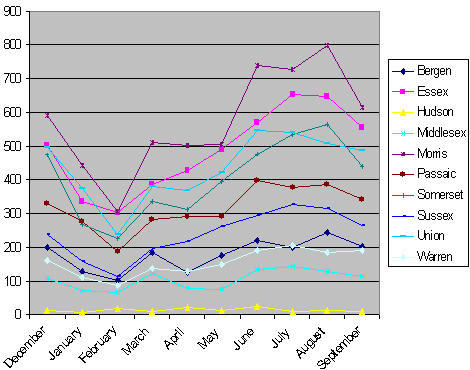
Bergen (16% decline)
Jun 218/Jul 200/Aug 243/Sep 203
Essex (14% decline)
Jun 570/Jul 651/Aug 647/Sep 556
Hudson (too low volume)
Jun 23/Jul 9/Aug 13/Sep 10
Middlesex (11% decline)
Jun 135/Jul 142/Aug 129/Sep 115
Morris (23% decline)
Jun 739/Jul 729/Aug 799/Sep 615
Passaic (11% decline)
Jun 397/Jul 378/Aug 387/Sep 343
Somerset (22% decline)
Jun 475/Jul 534/Aug 564/Sep 439
Sussex (17% decline)
Jun 296/Jul 328/Aug 317/Sep 264
Union (4% decline)
Jun 546/Jul 541/Aug 508/Sep 488
Warren (3% increase)
Jun 191/Jul 204/Aug 184/Sep 190
With trends like this, I don’t know how these peak prices can stay elevated for much longer. I called it a week back or so. This is the top of the bubble, I think we’re only going down from here.
Caveat Emptor
-grim
grim, do you have a similar chart for the past few years? that would give you the trend to see if in fact it looks different than prior cycles going into the ‘slow months’. thanks.
Looks like a seasonal decline. Prices and sales volume normally decline in the fall.
How do prices compare to the same period last year? Did prices decline at about this time last year?
Like you, I also think we are seeing the beginning of the cyclical decline, but your chart does not provide enough data to prove that.
I agree, if someone can provide me the data, I’d love to see changes versus this same period last year.
Unfortunately, any real estate specific data isn’t the easiest to get your hands on. I’ve been trying to get access to county tax databases to do the comparisons, but even that isn’t a trivial matter. Most of them are so far back that it would be many many more months before I’d even have acecss to the data.
The only thing I can offer up until then is to compare September with the December data I do have. The yearly peak is typically around August, the trough is around February. September numbers are roughly equal with December of last year, meaning we’re heading into the trough earlier and steeper than we did last year last year.
This isn’t going to be a short-term phenomenon. I agree that this could just be normal volitility, so we’re just going to have to wait until December to start drawing comparisons (or until hell freezes over and easy access to real estate sales data is available)..
I’m just trying to do what I can.
-grim
Nice to see inventories grow. This can’t be good for those that are in over their head with unaffordable mtgs and rising energy and property taxes.
Free markets work, but the real estate industry tries to keep all this information under raps to keep pyschology strong. Once pyshcology turns negative then buyers go into hibernation wanting real price concessions not token givebacks.
Thanks grim.
I watch the Mountain Lakes (Morris County) market weekly. I noticed three listings that disappeared for a month and then reappeared with lower prices and new MLS numbers. Prices are coming down.
Relisting is a common Realtor ™ trick. It resets the DOM (Days on Market) counter, and you lose the ability to track Changes in Listing Price (and it’s usually the original listing price that’s the telling figure). Those two pieces of data figure heavily into buyer psychology, thus, erasing them off the record works in the sellers (and selling agents) favor.
I’ve seen alot of relisting in Essex county, typically associated with very large price drops, one in particular was an old home in Bloomfield, I believe it was originally listed around $729,000, was on the market quite a while with numerous price reductions. It was relisted again at $599,000.
Another trick of these greedy realtors is if a house is for sale on the same street or next door they will not put a sign up.
Relisting and manipulation is a hallmark of these crooks.