
November sales data is in! Regular readers will likely recognize this graph, I’ve been updating it each month for a few months now. For new readers, this graph shows year over year unadjusted sales for 2003, 2004, and 2005. The reason I think this graph is important is that it shows the normal seasonality of the real estate market and allows comparison of current sales with historic sales for the last 2 years. This graph is based on GSMLS sales for the counties specified on the graph only. It does not include NJMLS or other FSBO sales. However, due to the fact that GSMLS is the largest MLS system in this area, I have faith that this graph illustrates the trends just fine. This data alone would be inadequate to use on a county level. Also, just because I get asked every time I post this. An analysis like this on a city by city level would be inappropriate, the sample size is much too small thus making the data too volatile, it’s only when you look at multiple counties aggregated that you get a true picture of activity.
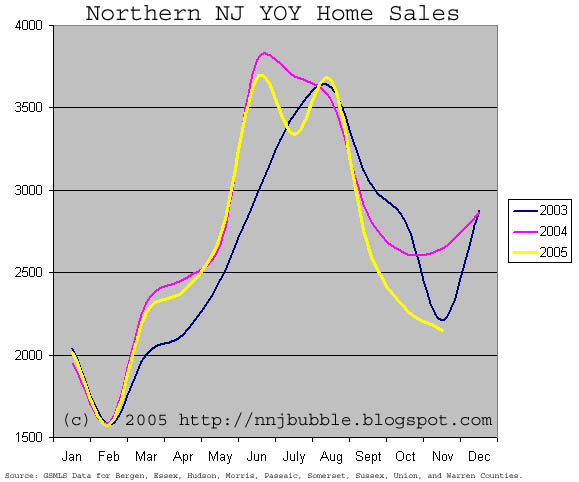
I think this data illustrates the anecdotal evidence we’ve been hearing about perfectly. Unlike the NAR and NJAR data that contains data up to 4 months old, this data is ‘fresh’. We can see that sales fell off relatively quickly after the summer peak come in significantly below last years numbers. It will be interesting to see how we track through the traditionally dead February. If you thought DOM numbers were getting high now, just wait until February.
Caveat Emptor,
Grim
seems like the bottom of the trough has come in Nov the last couple of years. if sales continue to fall for the next couple of months, it would seem to indicate that the slowdown isn’t just seasonal.
Thank you, this is great. The next test will be to see if December sales will pick up. If they don’t, that would seem to indicate a true freefall.
Grim:
Can you clarify better the data points?
If the graph is monthly data, the curvature of the plot implies that the data is continuous through the passage of time.
If the data is instead a single point representing the entire month, then a straight line between sample points would be more appropriate.
I know this comment sounds arcane, but the curve implies a much stronger trend that may in fact be the case.
Aesthetically, the curve obviously looks much better, but I don’t think that is your priority.
Grim
There were a bunch of RE related articles in Sundays Star Ledger (probably all available online).
— There was an article about corruption in Newark in assigning lots to developers at discount prices (corruption in Newark ? Unthinkable !!). One sidebar had a local economist commenting on how people are using illegal renters and dangerous loans to afford these (why on Earth would anyone pay half a million to live in Newark ?)
— The business section had a large article about RE and trends.
— Another article talked about how NJ had lost high tech jobs recently. And for those who talk about NJ’s prosperity, out of NJ taxpayers less than 9000 had incomes above $1M in the last few years.
Seeing as February tends to be the bottom, I would say it will be a long winter of us waiting. The spring should give better factual indication of what is going on. However – with all the media hype the past 2 months growing, and most of the winter ahead, I think that a huge amount of momentum will have built up by spring of ‘bubble-backlash’. I do think that it will take a couple years to really settle somewhere, but 2006 will be people in full panic, and pricing all over the place as nobody wants to be lowest. Should be a mess. You should see much more traffic in 2006 Grim!
the trend continues. most interesting will be the inventory that hits the market in spring and whether there are enough on the sidelines buyers to make a dent in it. i wouldn’t be surprised either way. what we haven’t seen are adequate price reductions that typically follow a drop in sales to spur demand. this will come when people realize the bloom is off the rose and isn’t going back on anytime soon.
In and of itself it isn’t all that interesting, the trough is only slightly below that in 2003.
Combine it with the fact that interest rates are creeping upwards, and the picture gets far more interesting.
“what we haven’t seen are adequate price reductions that typically follow a drop in sales”
Very true. For eg on X street in my town, although the max sales price for a house has been only 319K so far (thanks domania), the new listings are still coming out at between 329k and 399k asking. I am sure actual sales are taking place for lesser but the realtors are trying to keep up the pressure on buyers by listing high I think. It looks like “what we ask should not be a deterrant to your approaching us with your bid.”
We have to wait 6 months to understand where the curve is exactly going.
Do NOT trust the manipulation and spin from real estate industry. These self-serving people are onlky out for their own lifestyles.
First time buyers are screwed in this market.