
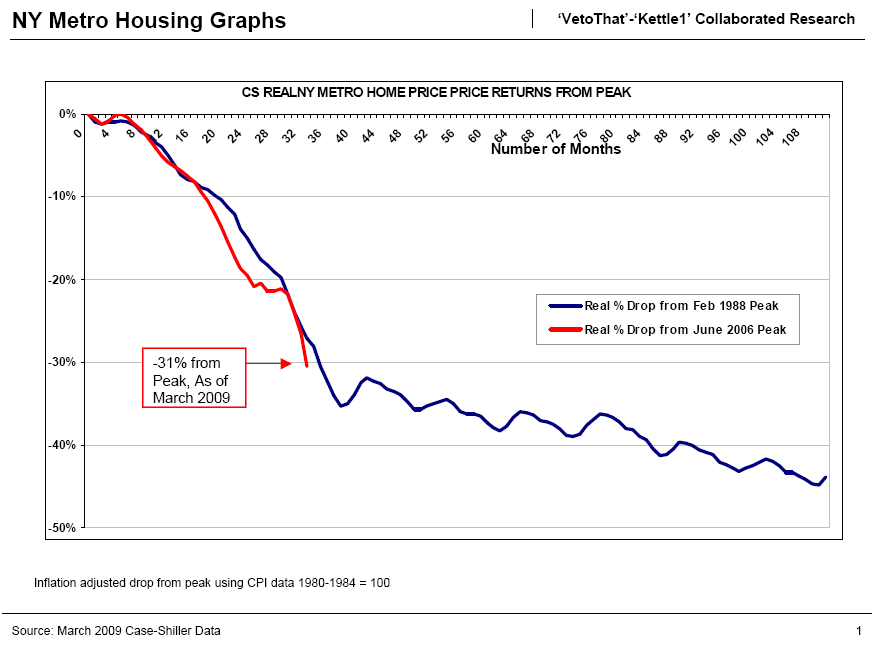
The New Jersey Home Price Index Tracker has been updated to include:
* March S&P Case Shiller (Aggregate, Tiered, Condo)
(click to enlarge)
(click to enlarge)
S&P Case Shiller NY Metro Commutable Area Home Price Index
Low Tier (Under $290k) – Peaked in October 2006 and is down 22.66% from peak
Mid Tier ($290k-$428k) – Peaked in September 2006 and is down 21.0% from peak
High Tier (Over $428k) – Peaked in June 2006 and is down 16.11% from peak
Aggregate (Overall Market) – Peaked in June 2006 and is down 19.68% from peak
Condo-Only Index – Peaked in February 2006 and is down 10.83% from peak
NY Metro Area Aggregate Year over Year Changes
Mar 08 -7.48%
Apr 08 -7.98%
May 08 -7.74%
Jun 08-7.04%
Jul 08 -7.04%
Aug 08-6.61%
Sep 08 -7.13%
Oct 08 -7.71%
Nov 08 -8.71%
Dec 08 -9.15%
Jan 09 -9.74%
Feb 09 -10.33%
Mar 09 – 11.79%
Unlike the broader market, which showed a slowing pace of price declines in March, the NY Metro Area saw price declines continue to accelerate to the fastest pace yet this cycle.
Bonus Graphs!
Courtesy of Veto and Kettle
(click to enlarge)
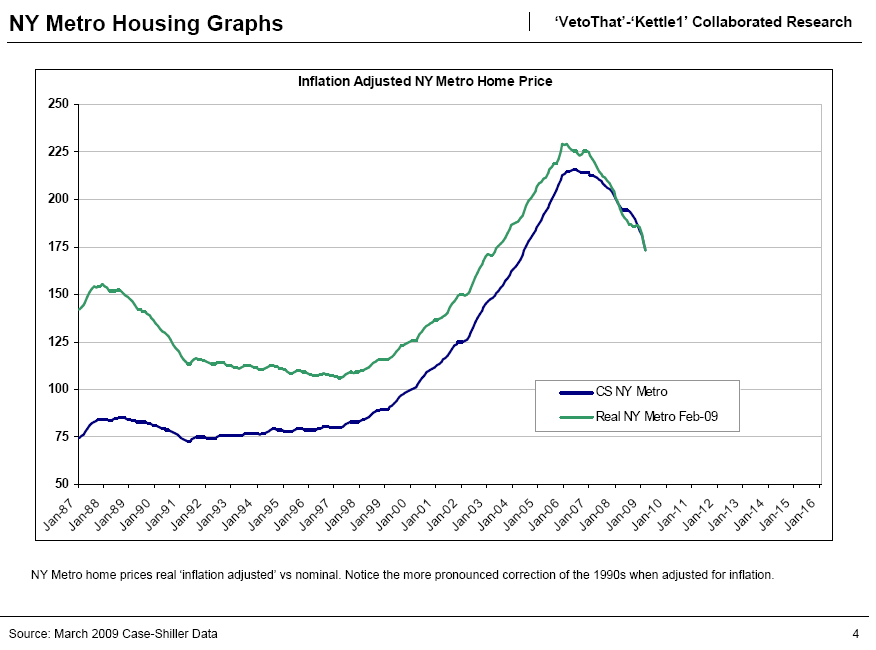
(click to enlarge)
nothing no 1st
“Few may question Vornado’s ability to survive the recession, but it clearly faces some serious challenges. The firm is heavily concentrated in the declining Manhattan market, where rent is sinking and availability soaring as companies flood the market with sublease inventory.
Vornado went on an $11 billion acquisition binge from 2005 to 2007, when prices peaked, leaving several assets worth much less now than the amounts paid for them.
The company has had to abandon an ambitious project to move Madison Square Garden and has written down the book values on 11 current projects, including the development of the Filene’s Basement site in downtown Boston.
The company also faces retail exposure with a one-third interest in heavily indebted Toys “R” Us.
Despite successful efforts to raise cash, the company is still roughly 60%-leveraged, analysts estimate. The company’s stock is trading in the mid-$40s, down from a high of $108 this past September.”
ttp://online.wsj.com/article/SB124338395661756651.html#mod=rss_whats_news_us_business
link to #2:
http://online.wsj.com/article/SB124338395661756651.html#mod=rss_whats_news_us_business
Clotpoll says:
I think Dunellen is the US home office for alcoholics.
Been to Manville?
It’s a toss up which place yields more drunks at my shop….
sl
http://www.ft.com/cms/bfba2c48-5588-11dc-b971-0000779fd2ac.html?_i_referralObject=5244294&fromSearch=n
Off the wall – thought some might enjoy – baseball – borrowing from the pages of the investment community.
From FT.com – “Long View: Lessons from baseball” – brought to you from Citi Field.
http://www.nytimes.com/reuters/2009/05/27/business/business-uk-korea-roubini.html
Roubini in the morning….
Clot, (is this your Op-Ed? ;) — you’ve been touting this for a while…. here it is in print:
http://online.wsj.com/article/SB124329282377252471.html
Here’s a two-minute drill in soak-the-rich economics:
Maryland couldn’t balance its budget last year, so the state tried to close the shortfall by fleecing the wealthy. Politicians in Annapolis created a millionaire tax bracket, raising the top marginal income-tax rate to 6.25%. And because cities such as Baltimore and Bethesda also impose income taxes, the state-local tax rate can go as high as 9.45%. Governor Martin O’Malley, a dedicated class warrior, declared that these richest 0.3% of filers were “willing and able to pay their fair share.” The Baltimore Sun predicted the rich would “grin and bear it.”
One year later, nobody’s grinning. One-third of the millionaires have disappeared from Maryland tax rolls. In 2008 roughly 3,000 million-dollar income tax returns were filed by the end of April. This year there were 2,000, which the state comptroller’s office concedes is a “substantial decline.” On those missing returns, the government collects 6.25% of nothing. Instead of the state coffers gaining the extra $106 million the politicians predicted, millionaires paid $100 million less in taxes than they did last year — even at higher rates.
No doubt the majority of that loss in millionaire filings results from the recession. However, this is one reason that depending on the rich to finance government is so ill-advised: Progressive tax rates create mountains of cash during good times that vanish during recessions. For evidence, consult California, New York and New Jersey (see here).
The Maryland state revenue office says it’s “way too early” to tell how many millionaires moved out of the state when the tax rates rose. But no one disputes that some rich filers did leave. It’s easier than the redistributionists think. Christopher Summers, president of the Maryland Public Policy Institute, notes: “Marylanders with high incomes typically own second homes in tax friendlier states like Florida, Delaware, South Carolina and Virginia. So it’s easy for them to change their residency.”
All of this means that the burden of paying for bloated government in Annapolis will fall on the middle class. Thanks to the futility of soaking the rich, these working families will now pay Mr. O’Malley’s “fair share.”
sl
anyone got advice for bar harbor places to visit, eat, etc?
thanks,
sl
(7) Still – Read that too. Very interesting. It sure has not paid out here in CA.
http://www.housingwire.com/2009/05/26/home-values-relief-for-some-havoc-to-others/
Housingwire “Home Values: Relief for Some, Havoc for Others”
“But as the typically hard-hit states are graced with some relief, price declines are now accelerating in what were once stable markets. 33 states are now showing an acceleration in price declines and 14 are experiencing double-digit declines – twice as many as a year ago.”
http://online.wsj.com/article/SB124338836675757049.html
The lobbyists are at it again…
“Banks Aiming to Play Both Sides of the Coin” WSJ
Industry lobbies FDIC to let some but toxic assets with taxpayer aid from own loan books
Sorry if this was posted but it’s time for more “fun with accounting” at the banks:
JPMorgan’s WaMu Windfall Turns Bad Loans Into Income (Update2)
May 26 (Bloomberg) — JPMorgan Chase & Co. stands to reap a $29 billion windfall thanks to an accounting rule that lets the second-biggest U.S. bank transform bad loans it purchased from Washington Mutual Inc. into income.
Wells Fargo & Co., Bank of America Corp. and PNC Financial Services Group Inc. are also poised to benefit from taking over home lenders Wachovia Corp., Countrywide Financial Corp. and National City Corp., regulatory filings show. The deals provide a combined $56 billion in so-called accretable yield, the difference between the value of the loans on the banks’ balance sheets and the cash flow they’re expected to produce.
http://www.bloomberg.com/apps/news?pid=20601109&sid=aJ0o66r8Ht9k&refer=home
Green shoots, nothing to see here, it’s all real, trust me.
Clot, the free market is in fact using “hope” as a trading strategy.
“World stocks continue to rally on US economy hopes” – AP
This is the same strategy employed by people who play the lottery.
http://www.washingtonpost.com/wp-dyn/content/article/2009/05/25/AR2009052502108.html?sid=ST2009052502127
5-page write up on Brooksley Born –
Credit Crisis Cassandra – Wash. Post
“Greenspan held an unusual take on market fraud, Born recounted: “He explained there wasn’t a need for a law against fraud because if a floor broker was committing fraud, the customer would figure it out and stop doing business with him.”
It that what Greenspan meant by “self-regulation?”
Don’t mess with Dunellen! There’s a decent Peruvian take out joint there and all of 529 is a speed trap.
“Clot, the free market is in fact using “hope” as a trading strategy.”
Seneca,
As is the consumer. Yesterday’s rise, consumer conf., was attributed to future expectations. The present conditions measure barely budged.
still_looking says:
May 27, 2009 at 7:37 am
anyone got advice for bar harbor places to visit, eat, etc?
________________________________________________
Cannot remember specific places but hit the all you can eat lobster joints. Also, when in Acadia National park, walk the carriage trails. They are easy walks that do not take a lot of time. Visit Cadillac Mountain at night to see the stars. On a clear night you will have a perfect view of the Milky Way Galaxy. bar. Finally, take a ride over to one of the smaller fishing villages on the island as they are nice to see. I think one place is Seal Harbor.
“The second wave of the housing crisis will likely be even bigger then we expected. What’s more, the “second wave” crisis that was thought to be over in late 2011 is now crashing down well into 2012. According to the group, the swell of option and unsecuritized ARM resets will not only be bigger than the subprime fiasco, but now it’s forecast to last twice as long.”
http://dailyreckoning.com/the-second-wave-of-the-housing-crisis/
Doom and gloom is always ‘just around the corner’, but never comes about.
“but never comes about”
Yeah 500K job losses each month and trillions of dollars of lost stock market and housing wealth; good one troll.
#19 – What doom and gloom?
Falling home prices is great news for sidelined buyers.
Maybe you think the situation is gloomy, but I’ve got a dozen clients and a few thousand readers (at least), that are giddy over the prospect of an affordable home. Lower priced homes and affordable housing will form the base of our economic recovery.
I see no gloom in the situation, are you sure that it isn’t you?
yes, we are happy to sit on the sidelines. Saving money everymonth, not paying property taxes, and slowly seeing our housing affordability go up and up. Can’t wait to buy a modest home which doesn’t suck the life out of us…in three years or so!
we,
Falling prices, doom and gloom? Quite the contrary. I imagine those on the sidelines with cabbage are thrilled.
From the Record:
North Jersey housing facing more declines
Home prices are getting closer to a bottom, but economists say they won’t bounce back with any strength until the job market starts to recover — probably in 2010.
“It’s going to be a very slow recovery,” predicted James Hughes, a Rutgers economist.
North Jersey home values in particular will suffer the effects of Wall Street job cuts filtering through the economy, said economist Patrick O’Keefe of J.H. Cohn, a Roseland accounting firm.
“Home pricing in this region is still going to drift downward,” O’Keefe said.
…
The numbers show that although New York-area homes continue to hold their value better than in some regions, price declines in the area are accelerating. March’s 11.8 percent annual drop was a record in the region. And home prices in the area dropped 2.5 percent from February to March of this year, after dropping 1.7 percent from January to February.
In Bergen County, according to figures from the New Jersey Multiple Listing Service, the median price of a home sold in March 2009 was $385,000, down 22 percent from $495,000 in March 2008. Bill Gilsenan, a director of the RealSource Association of Realtors in Northwest Bergen County, said that statistic reflects an increase in activity in the more affordable end of the market. First-time buyers are venturing into the housing market, drawn by lower prices and mortgage rates, as well as an $8,000 federal tax credit, he said.
In Passaic County, according to figures from Weichert Realtors, based on data from the Garden State Multiple Listing Service, home prices declined 17.6 percent from March 2008, to an average of $314,301.
…
Patrick Newport, an economist with IHS Global Insight in Lexington, Mass., predicted Tuesday that national housing prices will continue to drop into 2010 because foreclosures are still rising and the number of homes on the market is still high.
Rising unemployment is also a factor, according to Hughes and O’Keefe. The labor market is expected to “deteriorate into 2010,” according to Hughes, with unemployment topping out at more than 10 percent. People who have lost their jobs — or fear they will — are unlikely to take on a big mortgage, he said.
O’Keefe said hard times in financial services don’t just affect Wall Street professionals, but also many other workers who support the industry, such as printers, back-office workers and lawyers. Many of those workers haven’t been hit yet, but they will be, he said.
“That spillover effect is still in front of us,” he said. “The region’s unemployment rate is likely to overtake and then surpass the national rate.” Unemployment in New Jersey was 8.4 percent in April, compared with 8.9 percent nationwide.
Housing prices are unlikely to rebound until a healthier job market gives more people the confidence to buy homes.
“We still have to reconcile ourselves to a much reduced financial sector,” O’Keefe said. “That was the last growth engine in this area. It’s going to be a difficult couple of years for this region.”
(12) 12 HEHE –
More on the FDIC/WAMU situation from John Hempton @ Bronte Capital. He has been all over this, as a bond holder, from the beginning.
http://brontecapital.blogspot.com/2009/05/do-you-or-did-you-ever-have-friends-in.html
Do you or did you ever have friends in the FDIC?
“Sheila Bair – a Republican appointee no less – confiscated without compensation and without right of appeal valuable private property. I have argued repeatedly that she should resign – but now my basic thesis is proven her position is totally untenable.”
Grim – in mod @ 25 – I have no idea why.
Bronte Capital – on FDIC/WAMU
Bond of the day, get a great yield on an insured GO because of GM has scared off buyers.
DETROIT MICH G.O BDS SER. 2001-A 05.37500% 04/01/2015
Price (Ask) 92.309
Yield to Worst (Ask) 7.001%
Yield to Maturity 7.001436%
First-time buyers are venturing into the housing market, drawn by lower prices and mortgage rates, as well as an $8,000 federal tax credit, he said.
Bullsh*t, stop fishing for m*rons and stop trying to swindle people. You’re a liar. Go ahead, tell me; it’s a great time to buy, right?
If two minor children, brother and sister, who have a pretty-good-sized amount of cash between them decide to go in 50/50 on a house — their first RE purchase — can each of them qualify for the $8k first-time buyers credit and can they each use the $8k towards the downpayment?
Cindy,
He’s the same guy who broke the Biden Hedge Fund problems. Good website.
sl (7)-
The more you attempt to tax something, the less you get.
However, excessive taxation is a great way to grind the middle class into powder, which is the real reason behind these stupid tax schemes.
drawn by lower prices
What a minute… weren’t you the same people that said, “buy now or be priced out forever?” What’s the mantra going to be in a year from now?
MJore green shoots for future buyers.
“Housing Is Not Just Bad, It’s Getting Worse”
http://247wallst.com/2009/05/27/housing-is-not-just-bad-its-getting-worse/
25% VAT? This is under semi-serious consideration?
Emanuel argues in his book that a 10 percent VAT would pay for every American not entitled to Medicare or Medicaid to enroll in a health plan with no deductibles and minimal copayments. In his 2008 book, “100 Million Unnecessary Returns,” Yale law professor Michael J. Graetz estimates that a VAT of 10 to 14 percent would raise enough money to exempt families earning less than $100,000 — about 90 percent of households — from the income tax and would lower rates for everyone else.
And in a paper published last month in the Virginia Tax Review, Burman suggests that a 25 percent VAT could do it all: Pay for health-care reform, balance the federal budget and exempt millions of families from the income tax while slashing the top rate to 25 percent. A gallon of milk would jump from $3.69 to $4.61, and a $5,000 bathroom renovation would suddenly cost $6,250, but the nation’s debt would stabilize and everybody could see a doctor.
That’s more.
BC (16)-
I also expect my children to go to Princeton and Harvard.
However, today they make Rutgers/Maryland/Penn State grades.
BC,
By recovery, I wonder if they mean “stop falling through the floor” or do they actually expect things to go back to unsustainable yoy increases?
My team was looking for an intern. We send out offer twice in last 2 months but were rejected. It seems that the students have plenty of intern opportunity.
Anyone like tudor houses?
http://www.realtor.com/realestateandhomes-detail/Scotch-Plains-Twp_NJ_07076_1106031618
It’s listed at 379k in Scotch Plains.
Taxes are $8,100 a year.
How much would this have listed for at the peak?
Now if I only had a job…
Need advice on the housing market in the Whippany/Cedar Knolls area … been looking for the last 4 months … the comps given to me by my realtor are 6-months old so I don’t know how to evaluate the market value of homes in the market. Looking at homes in the $450K – $500K. Any tips on approaching an offer would be greatly appreciated …. thanks ….
#38 – Some things to consider
Are you looking for an intern, or a slave? The only firms that can attract slave labor these days are brands with huge notoriety, for example, Google. What was the compensation structure? Was there potential to move into a ft/salaried position post graduation? What was the compensation structure of the internship? What were the requirements of the internship? Also consider that you may be in an industry that simply doesn’t interest students.
Few people I know in the $100k range have multiple offers. The unemployed are in the $200k plus range, however their severance has not run out yet.
And some of the sub $40k ones are happy to be unemployed and collecting unemployment, food stamps, paid cobra and making money off the books.
‘Shore Guy’ did you have a letter published in WSJ this week, sounded like you.
gary (28)-
$8,000 tax credit? If you assume that houses in NNJ are losing their value at close to 1% per month, then on a 400K purchase that 8K is gone in 60 days.
All Hype,
Thanks! Wish the weather was gonna be nicer but, even an overcast day in Maine is better than a taxing, sunny day in NJ! :)
sl
No op-eds, no TV/radio appearances, and no WSJ letter today for this citizen.
gary (32)-
Drawn by lower prices? That’s a laugh.
It’s certainly not happening in NJ. Look at Grim’s monthly charts. People do note some lower asking prices, they get in the car, they take a look…then realize prices must fall a lot further before they represent value.
Lots of landlords around me signing their tenants to another year’s lease. There’s the current result of your “lower prices”.
Question…Clot? Grim?
I have friends who are in the process of buying a house. Despite my strong arguments against them buying now (POS cape that needs tons of work for which they have no money, they have a decent amount of credit card debt & they are buying knowing its too small, but thinking that they can fix it up and sell at a profit in a few years & upgrade…yes, I know), the Mrs. is insistent that she can not stand renting for one more minute and simply doesn’t care about this stuff or my compelling case for renting.
Well, they are in the process of looking for a mortgage and, hark, it turns out the husband was hardly claiming any income on his taxes (small cash business owner). So, on paper, their PITI to income ratio is around 44% (total debt to income over 55%) and they are having trouble getting financing. Question 1) What are their options? 2) Will they even be able to get a mortgage 3) If they do get one, what kind of rate are they looking at?
Clot,
There you go again. Insisting on looking beyond green-shoot hype and, instead, focusing on data and reasoning.
Do you have something against the American economic system?
gary, 28
Re: “Great time to buy!”
Been hearing that since ’06. still>/i> hearing that from people.
I just smile and nod….”sure, sure it is…thanks!!”
sl
“Drawn by lower prices?”
Drawn and quartered, perhaps?
off
whip (40)-
Go to your landlord, and extend your lease for another year.
This time next year, take a peek around again. Bet it will look better for you then than it does today.
Renting,
Let me get this straight. For some number of years, these folks have be committing tax fraud against the United States and against the State of NJ — pocketing ill-gotten gains and now they are worried that their crime will hurt their ability to get a mortgage? I suggest they spend a few years declaring all their income — like the rest of us — or just use their stolen money to buy the house for cash.
#46 clot,
Exactly. Prices are dropping, but pull out a calculator and figure out how much the payment is (principal, interest, taxes, and insurance) with 10% down and it’s still unaffordable for my family, even at a 5% rate.
rent (47)-
They’re screwed nine ways to Sunday. Can’t show minimal income/large revolving debt in this environment and do well getting a mortgage. If they qualify at all, I bet it’s only via FHA. Sounds like the rate could be mid-6 to 7ish.
Everything you mentioned sounds like the foundations for a slam-dunk argument to continue renting. I’d bet if they bought this house, they’d default within 24 months.
Good for me, though. I’ll need short sale client two years from now just as much as I need them today.
clot, 31
Now you understand my reluctance to buy a NJ residence…
…unfortunately my in-laws don’t understand that yet. Then again, they pay close to 16K in taxes.
Me? Even with a decent income, I’m too frightened to chain myself to indentured taxation servitude.
sl
Shore (48)-
Other than its increasingly fascist bent, baked-in corruption, treasonous self-dealing and childlike denial of reality, it’s great.
On the other hand, at least our mortgages aren’t denominated in Swissies, so I guess we’re ahead of Hungary and Bulgaria.
“Do you have something against the American economic system?”
RentinginNJ says:
May 27, 2009 at 9:18 am
Well, they are in the process of looking for a mortgage and, hark, it turns out the husband was hardly claiming any income on his taxes (small cash business owner).
Question 1) What are their options?
Stop lying to the IRS. They…ahem…kind of do not appreciate it….and will slap you down hard with impunity if you serve up a cream puff to them….
#49 sl,
When I hear “now’s a great time to buy” I just tell the clown who said it we are thinking of moving to Boston, Charlotte, Portland, (whatever city pops into my head at the time) or back to Australia next summer.
They shut up every time.
6#, so he still has his job… bi-bi roubini. hello goldilock!
>Roubini Says Bottom Of U.S. Recession Not Here Yet
47 – Your friends should apply directly to one of the government’s loan mod programs. The fact that they don’t have an existing loan shouldn’t matter. The gov seems to want people to buy houses at any price, esp first time buyers, and they don’t seem to have a problem rewarding people who get loans with 50%+ DTI. If anyone can come up with creative financing these days, its our fearless leaders.
BTW – Not to make people paranoid, but the IRS is not stupid. They have a million way to get at you if you give them a chance. These folks to whom renting is referring, let’s assume they come clean in 2009 to get a mortgage…don’t think they won’t be audited for 2008, 2007, 2006 etc. given the shot….
To institute a completely soci@list regime, any kind of vigorous or thriving middle class must be completely eradicated.
Soci@lism doesn’t work unless J6P is a completely unmotivated, malleable, order-taking tub of goo.
In mod
it is a great time to buy, just read this email a realtor sent me:
“Who do you know right now that is renting? With so many opportunities for first-time home buyers, everyone who is renting should at least explore what opportunities may be available. Sellers are now helping buyers with down payments, buying down rates, concessions, and much more! Who do you know that might want to learn more?
The real estate market changes quickly, so don’t let your friends miss out on this fantastic opportunity. Email or call me today with the names and contact information of people I may be able to help.”
RentinginNJ says:
Will they even be able to get a mortgage 3) If they do get one, what kind of rate are they looking at?
Nowadays, its nothing but full doc…if you’re self employed, they take 2 years tax returns and average the income. If that’s not enough, its like they say in Russia, “Tough shitski”.
The mortgage market is now working as it should have been. I don’t get the impression these people are really ready to do this. It’s in their best interest that they wait until they’re ready
Has anyone seen the Sociaism bumperstickers with the O replaced with the Obama O?
When soci@lism takes hold, it takes less than a generation to completely strip self-motivation and enlightened self-interest from an entire population.
#22 abbout: in three years or so!
You will not have to wait that long.
I wonder if Renting turns in these tax cheats whether Renting can get a cut, like with the whistleblower legislation?
Clot,
The Obamunists will make quite a bit of headway before the next presidential election.
x (66)-
FHA is working like a subprime sewer right now. They are churning tons of bad loans, made to people who shouldn’t hold title to as much as a car. All the old subprime mechanics have gravitated into FHA specialty outfits, and they are actively wielding white-out, tape, scissors and bogus documentation. I’m already hearing reports of immediate defaults on closings done within the past few months. There have also been several busts of phony VOE call centers in NJ.
The weird thing is, I believe the gubmint is complicit in this and doesn’t much care. When things really start to go to black in a couple of years, they’ll bust it out, a la Phony/Fraudy.
#41
I see great potential for the intern to become full time employee. With the tight budget, we think it is more likely to get the manager’s approval if the person to be hired has done some internship with the company. Don’t know about the compensation.
Also on the job finding, 2 of my former co-workers, who were laid off late last year, got job offers recently.
OT:
I brought in an espresso machine that wasn’t getting much use at home into my office this morning.
Does anyone know of a decent specialty low-acid coffee? Perhaps something sold by the pound at Fairway?
I understand low acid coffees are made either by being roasting longer (10-15X longer) or by treating the green beans pre-roast.
http://reiboldt.com/pevc/next-wave-of-innovation/
This is an interesting read – “The Next Wave of Innovation”
We could use one of those…
this is today’s ultrashort handle ranking:
bc bob 1 handle,
make money 2 handle,
kattle 3 handle,
HEHEHE 4 handle,
frank 5 handle,
clot 6 handle,
stu 7 handle
#65 secondary: The real estate market changes quickly
Jeez do these clowns ever stop!
Bi,
what exactly are you ranking???
Better short the market than short on brains.
http://economistsview.typepad.com/economistsview/2009/05/us-and-european-employment-rates.html
Kettle – Something for you…
“US and European Employment Rates”
If our “friends” in North Korea either shell the south or actually come across the border, what, if anything, is theshort-term effect on RE?
Between our economic issues and being overstretched in Southwest Asia, we may not look, to the loonies in charge in PRK, like as big of a defensive aid to the ROC as we did just a few years ago.
As we are always just “one shock” from exciting economic times, one wonders how the economy, and housing, would react.
#79 – Sesame St. impression. I’ve always liked the Count.
One! Ha ha ha.
Two! Ha ha ha.
Thhhhhhreeee! Ha ha ha.
Clot (73),
Until they get rid of the about 70% former used car salespeople working in this industry, it will continue.
Right now, the gov’t is more interested in hearing that banks are doing loans than ‘they’re doing good loans’
B.A.U.
At least the process of lying about your income is now considered fraud, be it prosecuted or not.
Grim, Clot,
What’s the typical percent sales price as a percent of final list this year? Is it in the 90 to 95% range?
“at least the process of lying about your income is now considered fraud, be it prosecuted or not”
Is it a lie if onehas “confidence” in their ability to earn “the number,” whatever. I thought I could. I thought I could. WTF, I thought I could.
40 months’ supply of homes in the 750K price range in the US right now.
Naturally, NAR calls for another raise in the conforming loan limits.
From MarketWatch:
U.S. April existing-home sales up 2.9% to 4.66 mln
U.S. April median home price down 15.4% over year
U.S. April home inventories up 8.8% to 3.97 miln
U.S. April home sales match expectations
Let me get this straight. For some number of years, these folks have be committing tax fraud against the United States and against the State of NJ — pocketing ill-gotten gains and now they are worried that their crime will hurt their ability to get a mortgage?
This has always been my problem with stated income mortgages; you are either lying to the IRS or lying to the lender. Someone is getting screwed. Thankfully they are largely history, although we will deal with their aftermath for some time.
Anyone seeking a govt. backed workouts on stated loan should be required to pay back taxes on their stated income.
Stop lying to the IRS.
My suggestion was to rent for another year and tell the truth on next year’s taxes. Let the chips fall where they may.
From Bloomberg:
U.S. Existing Home Sales Rose in April to 4.68 Million Rate
Home resales in the U.S. gained in April as foreclosure auctions and improved affordability spurred bargain hunters.
Purchases increased 2.9 percent to an annual rate of 4.68 million, close to forecasts, from 4.55 million in March, the National Association of Realtors said today in Washington. The median price slumped 15 percent from a year earlier, the second- biggest drop on record, and distressed properties accounted for 45 percent of all sales.
Record-low mortgage rates, tax credits and falling prices may keep boosting demand and trim the glut of unsold homes. In turn, a pickup in sales will help stem the slump in property values, which is key to shoring up household finances and construction as the economy begins to emerge from the recession.
“An increase in affordability has seemingly enticed potential homebuyers,” Michelle Meyer, an economist at Barlays Capital Inc in New York, said before the report. “We believe home sales have stabilized.”
Economists forecast resales would rise 2 percent to a 4.66 million annual rate from a previously reported 4.57 million pace in March, according to the median of 72 projections in a Bloomberg News survey. Estimates ranged from rates of 4.47 million to 4.8 million.
Sales were down 3.5 percent compared with a year earlier.
The number of houses on the market climbed 8.8 percent to 3.97 million in April, reflecting the gains usually associated with this time of year, NAR said. At the current sales pace, it would take 10.2 months to sell those homes, up from 9.6 months in March.
Home sales still falling, prices falling.
Green shoots!
Northeast home sales down 10.5% SAAR and 10.8% Non-Adjusted.
Worst in the country.
Cindy,
Thanks!!!!!
Over the year, average price in the Northeast down 9.6%, median price down 8.7%.
From MarketWatch:
U.S. home prices drop 1.1% in March: FHFA
U.S. home prices fell 1.1% in March, the Federal Housing Finance Agency reported Wednesday, and fell 7.3% in the past year. Home prices in the first quarter fell 0.5%, the government housing agency also reported. Prices fell in nine of nine regions in March.
#90 grim:We believe home sales have stabilized.”
Maybe in Cal, AZ, NV, but not in our area we are and will continue to decline.
grim, please kill 97 in mod
Its a great time to buy.
vs.
Its a great time to bide one’s time
I will go with the latter.
From Bloomberg:
U.S. stocks retreated after the Federal Deposit Insurance Corp. said the number of “problem” banks in the nation climbed to the highest in 15 years, spurring concern the financial crisis is far from over.
“spurring concern the financial crisis is far from over”
Have they NOT been paying attention until now?
Damn. They stole my idea:
http://online.wsj.com/article/SB124338175183056465.html?ru=MKTW
” Accenture Ltd. is seeking to become the latest company to switch tax-haven locales.
On Tuesday, the consulting and outsourcing firm said its board of directors had unanimously approved switching the company’s place of incorporation from Bermuda to Ireland.
The move comes amid a crackdown on tax havens by the O’drama administration and congressional Democrats, who are targeting companies with substantial U.S. operations that are incorporated in tax havens like Bermuda to lower their overall tax burden.
“There are continued questions about companies incorporated in Bermuda,” said Jim McAvoy, an Accenture spokesman. In its regulatory filing announcing the planned move, the company said it was motivated by legislative proposals that could increase the company’s taxes, negative publicity about companies incorporated in Bermuda, and by other factors such as the growing importance of the company’s European business.
In a trend that has gained momentum over the past six months, numerous U.S. companies are reincorporating from tax-friendly locations like Bermuda and the Cayman Islands to Switzerland and Ireland, in an effort to cope with what are expected to be significant changes in how the U.S. taxes multinational corporations.
As previously reported, Tyco International Ltd., Foster Wheeler Ltd., Weatherford International Ltd., Transocean Inc., Covidien Ltd., and Ingersoll-Rand Co. have all announced plans or finalized plans to make such moves over the past six months. . . .
Such moves could help companies preserve the tax benefits they had in Bermuda and the Cayman Islands, while using Switzerland or Ireland’s tax treaties with the U.S. to protect them from possible adverse legislation, according to tax experts who have advised companies on the moves. Bermuda imposes no corporate income tax. Switzerland has a corporate income tax, but doesn’t levy it on profits earned by subsidiaries overseas. Ireland also has a corporate income tax but doesn’t impose it on various intracompany transactions, thus making the tax relatively easy to avoid, say tax professionals.
Over the years, various pieces of U.S. antitax-haven legislation specifically targeted countries that don’t have tax treaties with the U.S., such as Bermuda. That could put companies incorporated in countries that do have tax treaties with the U.S. — such as Ireland — in a better position, according to tax experts . . .
Accenture board members have debated changing the site of the company’s incorporation for years, according to a person close to the situation. Directors “considered many different locations” besides Ireland, this person added. But the board didn’t consider moving Accenture to the U.S. “What shareholder would ever vote to incorporate in a country that taxes your world-wide income?” the person asked. . . .
Proposed legislation introduced in March could present a problem for companies shifting their place of incorporation from one tax friendly jurisdiction to another. Sen. Carl Levin of Michigan and Rep. Lloyd Doggett of Texas, both Democrats, submitted bills that both assume that companies controlled and managed in the U.S. — regardless of their place of incorporation — are subject to U.S. corporate-income tax.
[Solution? Run the corporation from Ireland. Or Toronto. Think those countries will turn down the business?]
Hello All! I don’t post much on this site- but wanted to provide some real data from the “field”. I have been looking to purchase a home in the North Bergen county area for last year or so. We recently bid on a small cape in a very nice area. It’s listed at $459,000 and we bid $425,00 (it needs work.) The owners countered with $449,000 – but we dropped our bid due to issues with the work that needs to be done. The reason for this post is the home was bought back in 2004 for $459,000. I know the owners put a lot of work into the home since 2004 – but here we are in 2009 and it is going to be purchase for less then the 2004 price!! So, yes, home prices are coming down. I believe they need to come down further – but they are based on what I am seeing (but again, not enough for me – yet!)
[102] redux
This is precisely what I wanted to do, but in reverse. Establish an Ireland corporation as a pass-through entity to the Caribbean, to avoid the new currency controls on cross-border transactions that will be imposed on non-treaty countries.
Federal Deposit Insurance Corp want money from Congress. The rest is just justification.
[89] renting
“My suggestion was to rent for another year and tell the truth on next year’s taxes. Let the chips fall where they may.”
That will get them an invitation to pay a visit to the friendly folks with a floor in the federal office building.
“Federal Deposit Insurance Corp want money from Congress. The rest is just justification.”
IB’s want debt to be guaranteed by the FDIC. The implosion was justification.
#103 Barry: Thanks for posting your observations.
Stated Income loans are still being done. You just need to put down closer to 30% that’s all.
The alphabet boys will never collect every penny they’re due.
Traitor nom deplume says:
May 27, 2009 at 10:43 am
[89] renting “My suggestion was to rent for another year and tell the truth on next year’s taxes. Let the chips fall where they may.”
That will get them an invitation to pay a visit to the friendly folks with a floor in the federal office building.
nom: to your point; they don’t have periodic tax amnesty programs for no reason;
From Bloomberg:
U.S. ‘Problem’ Banks Rise to 305, Highest Since 1994, FDIC Says
U.S. “problem” banks climbed 21 percent to the highest total in 15 years in the first quarter, and provisions set aside for loan losses weighed on industry earnings, the Federal Deposit Insurance Corp. said.
The FDIC classified 305 banks with $220 billion in assets as “problem” lenders as of March 31, rising from 252 with $159 billion in assets in the fourth quarter, the agency said today without naming any institutions. The FDIC said its insurance fund slumped 25 percent in the period.
“The first-quarter results are telling us that the banking industry still faces tremendous challenges, and that going forward asset quality remains a major concern,” FDIC Chairman Sheila Bair said today in a statement.
Regulators have taken over 36 lenders this year, including BankUnited Financial Corp. in Florida on May 21 and Silverton Bank of Atlanta on May 1, which combined cost the FDIC’s deposit insurance fund $6.2 billion. Twenty-one banks collapsed in the first quarter compared with 25 that failed in 2008, as the pace of failures accelerated amid the worst financial crisis since the Great Depression.
The end is nigh…..
OH NO!
Even Roubini Now Sees Green Shoots!
Posted May 27, 2009 09:13am EDT by Henry Blodget
When last we checked in with the good Dr. Doom, Nouriel Roubini, he was seeing light at the end of the tunnel. But he was still dismissing the happy idea that recovery would begin in 2009.
Well, Dr. D still thinks that the recovery will be weaker than expected, but now he sees it beginning in Q4.
Maybe these green-shoot things aren’t a dream, after all. Or maybe this sucker’s rally has been so persuasive that even Roubini has been fooled. (Based on the debt overhang and housing market, Roubini’s argument that the recovery will be disappointing still seems persuasive).
Reuters*: SEOUL (Reuters) – Economist Nouriel Roubini on Wednesday said the end of the global recession is likely to occur at the end of the year rather than the middle, and that U.S. growth will remain below potential afterwards.
“We are not yet at the bottom of the U.S. and the global recession,” said Roubini. “The contraction is still occurring and the recession is going to be over more towards the end of the year rather than in the middle of the year.”
“There is still too much optimism that a recovery is just around the corner,” said Roubini, a professor at New York University’s Stern School of Business and chairman of RGE Monitor, an independent economic research firm.
Roubini, who is widely credited for predicting the current economic turmoil, was speaking at the Seoul Digital Forum.
“A more sober analysis suggests we’re closer to the bottom; there is light at the end of the tunnel, but it’s going to take a while longer, and the recovery is going to be weaker than otherwise expected.”
Once the recession ends, “U.S. economic growth is going to be below potential for at least two years,” he said, amid multiple imbalances in the housing sector and the financial system, and the rise of public debt.
Roubini said the outlook for Asia was more positive than for Europe, Japan and the United States, thanks to stronger fundamentals.
“The latest economic indicators from Korea … suggest there is the beginning of an economic recovery, and growth might be already positive in the second quarter.”
The downside risk, Roubini said, was if advanced countries did not recover fast enough and if China’s rate of growth started to slow again.
Roubini predicted China would post a 6 percent growth rate this year, a “hard landing” considering it grew by 10 percent for a decade.
A robust recovery in Korean, China and other countries in the region would depend upon relying less on external demand and export-led growth and relying more on domestic growth, he said.
(Reporting by Marie-France Han; editing by Chris Lewis)
grim says:
May 27, 2009 at 9:57 am
#79 – Sesame St. impression. I’ve always liked the Count.
One! Ha ha ha.
Two! Ha ha ha.
Thhhhhhreeee! Ha ha ha.
Dedicated to JJ!
http://www.youtube.com/watch?v=B-Wd-Q3F8KM
kettle, re: Russia dumping dollar
And now it’s official – Russia Central bank is dumping dollar in favor of Euro. They are going to increase Euro part to 55% by October and to 60% by 2010.
Can’t give you a source
bi says:
May 27, 2009 at 9:48 am
this is today’s ultrashort handle ranking:
kattle 3 handle,
kattle has his pant up….
Chi,
Saw that this morning. What can I say about Roubini? He’s wrong.
Fire,
thanks for the update. The US $’s days as reserve currency are numbered. its now just a matter of time. My guess is we see a currency basket take its place, possibly with a gold component
[110] chi,
there is no federal tax amnesty, and if you participate in the state version, you have essentially dimed yourself out to the IRS as NJ will share info with IRS.
Provided returns have been filed, the SOL is already running. I can’t advise someone on how to quietly get compliant and wait out the SOL, but that is a question to be asked.
As for paying cash for that house, well, the friendly folks (and they really are friendly; brutal on your wallet but friendly) at IRS will look at that purchase and ask “so, where’d you get the money?” Be prepared to have a provable and legal answer for that. IRS busts more people for living in 800K homes and driving 100K cars on 40K reported income.
Inside the Black Box: Jones Day Staff Salary Freeze
Wednesday, May 27, 2009 11:13 AM – By Elie Mystal
As many of you know, Jones Day guards its salary information as if the firm is protecting the Holy Grail. Compensation is kept confidential and talking about what you make, even to colleagues, is generally discouraged.
But no firm is immune from the global economic crisis. Today, a piece of information leaked out of Jones Day regarding a freeze on staff salaries:
http://abovethelaw.com/2009/05/inside_the_black_box_jones_day.php
cartoon of the day
http://2.bp.blogspot.com/_9ZzZquaXrR8/Shw4lzikylI/AAAAAAAADug/KVok4V7amgM/s1600-h/1776Cartoon.jpg
#120 kettle1
Beauty. LMAO
“Why yes, these ARE very find bonds indeed.”
http://3.bp.blogspot.com/_H2DePAZe2gA/ShoTsrycmJI/AAAAAAAAJHk/3Ho79QeHwQs/s1600-h/cardsharps.JPG
err find=fine
Buying a house is like buying a stock or a car, you have to be prepared to get wiped out. My first place I bought at 1x income. Got to keep it real baby, leverage is a bitch, go 10X income on a house be prepared for 10x the gains or bankruptcy playa.
Is this a nice way to talk about our first lady?
HEHEHE says:
May 27, 2009 at 11:40 am
Inside the Black Box:
make money says:
Stated Income loans are still being done. You just need to put down closer to 30% that’s all.
Stated income loans were originally offered for wealthy self employed people who just didn’t want to deal with the hassle of providing reams of tax returns and questions. It was offered through private banking institutions.
If you have a 30% downpayment, you’re probably doing ok. I’m sure the FICO requirements are much higher now too.
Following up on yesterday’s thread about the house in Belmar:
Thanks NJC! I am thinking about renting the place for 2 weeks this summer, to test out Belmar. I’ve been renting for the summer vacation in Bradley Beach but the taxes there are MUCH higher than the ones in Belmar if one wants to buy.
Shore – agree with you too that doubling the price in a year is a bit greedy, especially as the market was falling apart. Prices have still not come down that much though – as this house illustrates.
I’m trying to figure out how to get access to the bank sales in these areas. There have got to be better deals than what is listed on MLS. The house I was looking at for a while in Bradley was at 216 (I think) Evergreen and was originally listed at more than $1 mil but was sold by the bank for 545K, as is – CO to be obtained by the buyer. It was a mess but the bones were good, view of the lake, 2 blocks to the beach. estimated work: 150,000. That seems like a better buy than the place in Belmar even though my mother said the house was beautiful and has an apartment you could rent out. Small yard though and very far to the beach.
There’s an empty lot for sale in Bradley too – 545K nice 50 X 150 was thinking of maybe talking to a builder to see about building something maybe getting exactly what I want for less…Thoughts?
It sounds like the cash-business cheats have been too clever by half. Not only do they harm their ability to get the mortgage, and face the potential of jail or civil penalties, they did so for no good reason. Had they opened a solo 401(k) they could have sheltered a boatload of money from the tax collector, been able to show considerable savings, and otherwise made their lives less complicated.
I say let them serve 30 days, pay back what they owe plus interest and penalties and then let them get back to life.
In the meantime, I suspect they should start seeing “growth” in sales and profits.
Shore (128) –
How is this any different from corporations creating “tax havens” in the Caribbean?
Lord knows that I am no fan of Obama, but in this case, I agree with his actions.
http://chronicle.com/news/article/6531/dartmouth-college-its-bond-rating-downgraded-takes-on-more-debt
An Ivy league school is downgraded today. They borrowed 400M for a project and cash reserves. It’s funny how drunked sailor spendings continues on a credit card when the income is no longer there.
i thought you wanted to be monica ii pre-election.
>Victorian says:
May 27, 2009 at 12:30 pm
Shore (128) –
Lord knows that I am no fan of Obama, but in this case, I agree with his actions.
The US economy is driven in large part by the consumer. The consumer is over extended and has to much debt. I see no mechanism whereby their debt actually gets paid down other then we lower their monthly payment yet maintain their balances. Until debt is paid down I just do not see where this “growth” “recovery” will come from.
Victorian,
As someone who pays ALL of his share, I say go after all the cheats — including Rangle.
More Green shoots!
http://finance.yahoo.com/news/Recession-suddenly-humbles-apf-15337375.html
Recession suddenly humbles high-tech sector
“High tech regions, which throughout most of 2008 were far more economically secure than the rest of the country, are now seeing unemployment, foreclosure and bankruptcy rates on par with national averages, and in some cases even higher.
Even the most optimistic high tech community leaders have had to face facts.
“We had hoped we might stay insulated from the global economic crisis, and for a long time we were,” said Silicon Valley Network president Russell Hancock. “But then it caught up with us and now everyone is laying off.”
Everyone?
“There isn’t anybody who isn’t laying off,” he said, then draws a long breath before reciting this list: “Microsoft, Intel, Hewlett Packard, Sun, Yahoo, Apple, Google.” He pauses a moment to consider that. “Google. When Google is laying off you know something is going very wrong.”
More Green shoots!
http://finance.yahoo.com/news/Recession-suddenly-humbles-apf-15337375.html
Recession suddenly humbles high-tech sector
“High tech regions, which throughout most of 2008 were far more economically secure than the rest of the country, are now seeing unemployment, foreclosure and bankruptcy rates on par with national averages, and in some cases even higher.
Even the most optimistic high tech community leaders have had to face facts.
“We had hoped we might stay insulated from the global economic crisis, and for a long time we were,” said Silicon Valley Network president Russell Hanc0ck. “But then it caught up with us and now everyone is laying off.”
Everyone?
“There isn’t anybody who isn’t laying off,” he said, then draws a long breath before reciting this list: “Microsoft, Intel, Hewlett Packard, Sun, Yahoo, Apple, Google.” He pauses a moment to consider that. “Google. When Google is laying off you know something is going very wrong.”
Bi (131) –
When facts change, so does my opinion. Apparently, that is a concept alien to you.
Shore (133) –
Agree 100%.
On a side note, even though we probably come from opposite ends of the political spectrum, I have always found you to be highly principled, sensible and not a rabid partisan.
Vic, Shore,
you both clearly need extensive re-education!!! of to Gitmo for you both! 2 rational people should never come to terms on a subject they disagree on!
Tosh,
at the rate we are going, City 17 may have been a training sim ;)
Real Estate related..yes?
http://cosmos.bcst.yahoo.com/up/ylocalnews;_ylt=ArcuQUK8U.2VqzEFPbu7ktWs0NUE;_ylu=X3oDMTE1dDczc2tkBHBvcwMxMQRzZWMDeW5fdmlkZW9zBHNsawNpY29uaWNob3VzZWY-?ch=4226712&cl=13675837&lang=en
#47,
Do you have a lower opinion of your friends now that you know they are tax cheats?
“this is today’s ultrashort handle ranking:”
Bi [77],
Of much more importance, the Real is getting closer to the 2 handle. BOOYAAA.
Anybody think this story will be repeated in NJ?
http://online.wsj.com/article/SB124329282377252471.html?mod=googlenews_wsj#printMode
“On a side note, even though we probably come from opposite ends of the political spectrum, I have always found you to be highly principled, sensible and not a rabid partisan?”
Thank you. I try to achieve those things. Unfortunately, because of them, I am largely an outcast in what remains of my party. Of course, if it keeps going the way it is going, we will be able to hold our convention in a Dairy Queen in Austin, TX, with room to spare.
[142] w8ting
already is.
[136] victorian
“I have always found [Shore] to be highly principled, sensible and not a rabid partisan.”
For rabid partisanship, you need only to prod good ol’ Nom. ;-)
And up in NY.
Victorian says:
May 27, 2009 at 12:37 pm
Bi (131) –
When facts change, so does my opinion. Apparently, that is a concept alien to you.
–noun
1. something that actually exists; reality; truth:
2. something known to exist or to have happened
Sorry, facts don’t change. Circumstances and opinions change, but facts do not.
#103 Barry
I’ve been shopping for houses too, in Union and Essex county, and it’s obvious that sellers have a lot of waking up to do. They really are in a dreamland—that they bought in 2005 for x amount and won’t take a loss. I see where they’re coming from, though. If they sell, they lock in their losses. But if they wait and put their pos on the market in another year or two, they might lock in even *greater* losses.
I suspect, in six to twelve months, a world of hurt is gonna crash down on many would-be home sellers. So the wifey and I are biding our time. I suggest you do too.
In terms of statistics, many of the sub $500K homes have sold at 93% of list prices (according to my anecdatal research), so that’d make your $459K sell at $426K, which is almost exactly what you bid! They were stupid not to sell — as you wisely yanked your offer. I believe the sell percentage is gonna drop below 90% of list price, so that’s a 10% discount for you, if you can find a decent home to buy.
Good luck to you!
[128] victorian
small business not declaring income = illegal.
corporation setting up offshore entities to keep offshore earnings offshore = legal (for now).
This has been another edition of easy answers to easy questions.
JULIE,
FACTS DO INDEED CHANGE.
if a classroom has 5 boys and 5 girls in it then it is a FACT that the class is 50% boys. if the next year there are only 3 boys and 7 girls, the Fact of class makeup has changed to 70% girls.
Willem Buiter from the CFR has a really interesting post on proposed changes to the financial system. A lot of what he writes was already seen in the G20 working paper, but it’s an interesting read none-the-less.
FTFA;
I guess in the technical legal sense of the word there is a difference in the method of tax avoidance but in the actual impact there is none.
The immediate negative reaction to the small business and positive reaction to the corporation with the resources to avoid paying taxes really is off putting.
Technically, a lot of the mortgage shenanigans in the past 8 years weren’t illegal either but they did have a morally criminal impact on our economy.
For the most part, nobody gets rich by evading taxes. If every small business paid every cent, many would go under. That’s lost jobs and revenue that gets dumped into the system.
Many are small businesses and the money that they make goes right back into the system.
Nom: the IRS is forbidden to do ‘means audits’. Whether the still do them is the question. It’s hard to defend a lavish lifestyle that is supported with a business that makes no money.
Since the bubble popped, we’ve uncovered and honed in on another and possibly greater evil; rising boundless property taxes.
Buying ahead of the bottom isn’t scary, you can gauge your downside risk to a certain extent.
Buying into a failed state is.
To the realtors on this site: Are you seeing less homes being put up for sale because homeowners can’t get what they want for their houses? Or has it been pretty much status quo?
[153] d2b
Agreed that having a lot of toys is not probable cause for CI to start delving into your life (yet). Once you are under investigation, however, they can and do use your acquisitions to impute undeclared income.
Kettle,
Note:
2. something known to exist or to have happened
Not going to get into a war of words, however, just because year two had 70% girls, that does not change the fact that year one had 50% girls. A new fact does not ERASE an old fact.
#138 – at the rate we are going, City 17 may have been a training sim ;)
As long as we don’t go straight to a Doom-esque “Knee Deep in the Dead” I’ll consider things positive!
[154] zieba
Speaking of failed states:
Imagine how nuts the Tea Party crowd is gonna go if the O-dministration goes through with a rumored bailout of state governments.
Think the folks in Texas will start drawing up those Articles of Secession if they know that they are gonna be handed the bill for guaranteeing Cali, NY and NJ bonds?
Anyone here have any insights into what is going on with the 10yr? I can think of reasons to avoid it, but why now? Why not 3 months ago?
Tosh,
was really leaning more towards the social environment, mostly joking. Although some head crabs would make life interesting. (Bull market in crowbars!)
CA, NY, NJ and TX have been contributing more taxes than they received in federal funds states for years.
http://www.scribd.com/doc/8229012/Tax-Donor-or-Contrib-States
BC Bob says:
May 27, 2009 at 1:07 pm
“this is today’s ultrashort handle ranking:”
Bi [77], Of much more importance, the Real is getting closer to the 2 handle. BOOYAAA.
Bost & CLOT & others:
For those of you playing along at home, I just lobbed a call into Mecca of Short (a.k.a. ProShares in Bethesda). I asked the logical question…what happens if this b!tch goes to zero? Does it bounce off or do you guys shut it down? Essentially, you could get the casino treatment. What does this mean? You go to the casino with money and an ATM card. It doesn’t matter if you were merely on a bad streak that tapped you out. If your chips are gone, you hit the ATM limit for the day, and you can’t pull marker from the pit boss…..YOU’RE DONE.
I asked “Sebastian”…so WTF happens?
Sebastian: we haven’t decided yet…
Me: What?
Sebastian: The board will need to make a decision about what will happen.
Me: Well, you are just a small equity rally away from needing to answer this question. Are you planning to disseminate something to the public? What is being socialized in your office?
Sebastian: We have no comment.
Me: Thank you.
ten year is getting smacked in muni, investment grade and junk rally. right or wrong default risk at Citi, AIG, BAC, F etc. is off the table, if I can get citi at 9%, AIG at 28%, BAC at 9% and F at 16% why am I buying taxable ten year Treasuries at 3%
10K citi at 9% is 9k interest over ten years
10K treasuries at 3% interest is 3K over ten year
10K Ford at 16% is 16K over ten years
10K AIG at 28% is 28K over ten years
If you think citi is backstopped and default risk is low why not get triple the yield. The Fed wants credit spreads to narrow. To do that Treasuries must rise while Corp yields fall.
chicagofinance says:
There is a big difference between getting wiped out in an ultrashort and wiped out in a casino, at the casino you may be broke but you got comped on drinks and food, caught a free show and if you lost enough a nice little rug and a tug to settle your nerves. The ETF you just lose it all and you don’t even get the lube.
Chi [163],
As per my post, more interested in the Real.
If you think citi is backstopped and default risk is low why not get triple the yield.
Is there any doubt that C and BAC are being backstopped? But, you can see the logical problem here, can’t you? USG backstops everyone, they stop buying 10yrs cutting the amount USG has to backstop with.
[162] silera,
that status changes depending on the study.
Hard really to know what is correct, but that is not the statistic that worries me.
Still Looking:
I went to Bar Harbor last year and tried a few places:
We liked:
Rupununi for upscale casual with some interesting flavors
The Reading Room at the Bar Harbor Inn for a fancy, upscale, expensive celebratory meal.
I didn’t like one place on the water next to where the cruise ships lets the captives out. I suspect that is the rip-off zone.
The Thai place was nothing special, the Chinese place was ok.
The ice cream places all seemed to be good.
Julie (158) –
Do you then base your present decisions based on “old” facts or “existing” facts?
For all intents and purposes, the facts have changed.
Barring some kind of economic collapse, you can say bye bye to 4.5% mortgage rates.
s_l (8)
We stayed at a nice B&B in Bar Harbor, the Atlantean. Would recommend, great location but not kid friendly.
Acadia was great and plenty for those who are not hardcore hikers.
Had more luck with the ice cream in Bar Harbor than the dining.
Enjoy.
Plume- I think I just come from the thought process that thinks of the US as one whole. There’s a complete opposite sentiment that the US is just many pieces.
Obviously, to be whole be need all our pieces but it’s facetious for Texas or any other state to make dumb statements regarding seceding.
I’m just sitting back now and digesting. I’m not sure on Obama, or the taxes or the stimulus or much. I know that I agree with him philosophically on many issues, but I agree with the Catholic Church on many issues too. It doesn’t mean I want to high five child abusers.
It’s easy to become engulfed in the me and mine right now, and necessary obviously for many reasons. I just never want to become that person that outways the me over the we. As a nation I definately think we became a me over we for the last 10 odd years and it didn’t do much for anyone.
“Barring some kind of economic collapse, you can say bye bye to 4.5% mortgage rates.”
And goodbye to bank refinance profits. What will save them now?
RE: Anyone like tudor houses?
Sure, but that’s not really a Tudor, but more like a dormered Cape with some Tudor stylings.
http://www.realtor.com/realestateandhomes-detail/Scotch-Plains-Twp_NJ_07076_1106031618
Anyone like tudor houses?
I love mine …. :*)
re: #172 Grim – Mortgages are for suckers!
When the rapture comes I will be buying two and paying cash.
“And goodbye to bank refinance profits. What will save them now?”
Stu,
Credit value adjustments.
tosh (160)-
1. The bond vigilantes are out. Their demand is for yield.
2. The Chinese will not keep buying unlimited amounts of debt forever. Their buying activity is now almost exclusively at the short end of the curve.
This is one ugly house:
http://p.rdcpix.com/v02/lebb10442-m0o.jpg
These headlines that say sales are up when they are actually down drive me crazy:
Bloomberg wrote:
“U.S. Existing Home Sales Rose in April to 4.68 Million Rate
… several paragraphs down…
Sales were down 3.5 percent compared with a year earlier.”
Normal seasonal patterns is not “growth” in the economic context.
I’d like to see some reasonable time series analysis performed to see the odds that a lot of our economic data stays negative even into Q409. A lot of the sharp deceleration didn’t get started until late Q408. I just don’t see easy yoy comps for a lot of stuff globally until very late 2009 to early 2010.
Chi (163)-
I’m loaded up to the extent I want on SRS. My two new ProShares toys- PST and TBT- short USTs.
Good times. All disclaimers. Only bi is the all-knowing seer of investment.
Chi,
I seriously doubt any of those ETF’s touch zero. There’s too many trading desks that use them as hedging instruments. That’s part of the reason for the price drop, absent any volatility there’s no need to hedge.
tosh (167)-
It’s a very sophisticated circle jerk. The only guarantee is that it’ll all end in disaster.
Also a strong contender;
http://p.rdcpix.com/v02/l80772142-w0o.jpg
Clot,
I am firmly in BC’s camp. All i want for Xmas is a few tons of NPK and a silo ;)
Zeiba- those look like office building in industrial parks.
Englewood Cliffs.
Both are just under/over 2,000,000.
The second one looks like a catering hall mated with a house of worship.
grim 189 in mod.
Lots of bad words in it.
Barca Scores!!
The question is who gets stuck with the bag of crap, JPM and GS were up to their neck in subprime/MBS profits in 2000-2006 but passed the bag of crap in time. The heads of these firms would have been fired in 2000 to 2006 if they had not jumped in and way underperformed, the trick is you have to time the market twice once on the way in and once on the way out. Junk bonds are the same now. Stuff I jumped in on with 40% yield back in March I could care less what happens. Now with junk selling for 14% you are playing in the mine field. So far so good but defaults are going to be there and at 20-40% ytm you could absorb them, but now people at 10-15% are playing dodge ball and they are going to get hit.
toshiro_mifune says:
May 27, 2009 at 2:13 pm
If you think citi is backstopped and default risk is low why not get triple the yield.
Is there any doubt that C and BAC are being backstopped? But, you can see the logical problem here, can’t you? USG backstops everyone, they stop buying 10yrs cutting the amount USG has to backstop with.
Qwerty,
That’s pretty cheap for a 4br/3.5ba in Scotch Plains, “the Best Affordable Suburb in NJ” according to Businessweek.
It also looks pretty small for 4br/3.5ba, so I wonder where they squeezed them?
But there’s one huge huge catch. It’s right on Route 22. Probably ten feet away. Photographer cropped this very busy highway out of the photos. 207 Victor St. But at least it’s not next to Plainfield.
#189 zieba
Both are proof money/access to credit does not equal good taste.
http://www.speakingofsports.com/Categories/SportsSpeakers.htm
you can buy anything in america online
learn english with O
http://www.sinosplice.com/life/archives/2009/05/23/learn-english-with-obama
HEHEHE says:
May 27, 2009 at 2:44 pm
Chi, I seriously doubt any of those ETF’s touch zero. There’s too many trading desks that use them as hedging instruments. That’s part of the reason for the price drop, absent any volatility there’s no need to hedge.
HE: Honestly, I was incredulous that the jerkweed at Mecca of Short didn’t have an answer for me on the recorded line. It means that these fcuks are playing by the skin of their teeth on a logistical level. It opened my eyes to a much wider possibility of operational risk. Tracking error should should be assumed and be unpredictable, not due to design, but because they are fcuking sloppy.
Clotpoll says:
May 27, 2009 at 2:44 pm
Chi (163)- I’m loaded up to the extent I want on SRS. My two new ProShares toys- PST and TBT- short USTs. Good times. All disclaimers. Only bi is the all-knowing seer of investment.
clot: note the distinction between the PST and TBT; these are different markets with different investors; also keep your ear to the track regarding sovereign manipulation and also our own Treasury.
You guys beat me up on Wisdomtree stock calling the ETF shop a bunch of bozos yet you question how a place that runs ETFs can be sloppy.
“Tracking error should should be assumed and be unpredictable, not due to design, but because they are fcuking sloppy.”
I realized their sloppiness when they performed their distributions without any warning to their holders back in 2007. Nothing like waking up to a huge down day for no apparant reason.
Praise google.
‘John’ and ‘Wisdomtree’ should be banned from being used in the same sentence! :P
Anyone want to hazard a guess as to when we cross %4 on the 10yr? Yield is 3.724 right now.
I can’t imagine the Fed is happy with this.
“Tracking error should should be assumed and be unpredictable, not due to design, but because they are fcuking sloppy.”
Here’s my idea of sloppy: a sham, fascist gubmint that prints Treasuries- backed with a fingers-crossed guarantee of nothing- at the rate and quality of Marcal recycled one-ply asswipe, then crams them into the market in big, puking, horse-choking quantities, while paid-off media shills cheer the whole scurvy operation, calling it genius when what it all really equals is sheer madness.
“I can’t imagine the Fed is happy with this.”
Tosh,
Maybe they should stop printing. They shook down the thunder from the sky, now the vigiliantes are testing their resolve. Who says you can’t fight the fed.
Tevez coming on to save Man U’s sorry asses. They go to him every time they’re in a pinch, but they won’t sign him to a contract.
‘Cause even Man U’s broke. The Glazers are tapped out.
Welcome to the new era of the UST as junk debt.
WSJ
ROI
MAY 27, 2009
Is Your Home A Good Investment? As assets, homes provide only modest annual returns in the long run.
By BRETT ARENDS
There’s the usual talk about what the latest Case-Shiller house price data mean for the next short term move in the real estate market. Has housing bottomed? If not, has the rate of decline slowed? And when will we see an upturn?
Human nature likes the short term. Which is why so little attention is paid to something that is probably more important, if less urgent: What the latest data show about the long-term of the real estate market.
And it’s startling.
We have just been through the biggest boom in real estate in American history. The subsequent bust surely hasn’t finished.
Yet look at the numbers. Since 1987, when the Case-Shiller index of 10 major cities begins, it’s risen from an index value of 63 to 151. Annual return: Just 4.1% a year. During that period, according to the Bureau of Labor Statistics, consumer prices rose by 3% a year. Net result: Home prices produced a real return of just 1.15% a year over inflation over that time.
Critics may point out that the analysis is unfair — after all, it starts counting near the peak of the 1980s housing boom. Fair enough. Look at the performance since, say, early 1994, when home prices were near a historic trough. Surely someone who bought then has made a bundle.
Not necessarily. Since then the ten-city index has risen from a value of 76 to 151. Annual return: 4.7%. Inflation over that period: 2.5%. That’s still only a real return of 2.2% a year above inflation.
You can often do better on long-term inflation protected government bonds.
And real estate often costs 2% or more a year in property taxes, condo fees, maintenance, insurance and the like.
Conventional wisdom long held that home ownership was a route to wealth, and the imputed rent — in other words, the right to live in your home — was just part of the value you got from it. Under that widespread view, the recent housing bust was simply a temporary, though deep, pothole.
Yet for very many people, even over the past 15 or 20 years, the imputed rent may have been all, or nearly all, the real value they actually got from their home.
Yes, it’s only recent data. And it’s only ten cities. But there’s some reason to suspect these numbers may, if anything, flatter real estate performance. After all, it’s hard to look at the data and figure the bust is now over. And if they fall further, those long-term return figures will fall too.
Prices weren’t just down 19% over the past year. They fell 2% just between February and March. And it’s not the worst-hit markets that worry me the most — Phoenix is down 53% from its peak, Miami 47%. That smells of capitulation. It’s the other markets. New York and Boston are only down 20%. Denver’s only down 14%.
Overall the ten- and 20-city Case-Shiller indices are merely back to mid-2003 levels. After the biggest boom and bust on record, history suggests things don’t stop getting worse until they’ve gotten a lot worse than that.
Write to Brett Arends at brett
#205 Clot
Marcal is a bad example, they went bankrupt. Oh Wait!
Quality and value is what you get when buy Coronet (or US Treasuries).
Oh man…big free agent signing….
NFL Veteran Joins Morgan Stanley
By Helen Kearney
May 27, 2009
Former New York Jets wide receiver Wayne Chrebet has joined Morgan Stanley’s office in Red Bank, N.J., as a financial advisor.
He joins a six-person team led by Ed Moldaver, who is a member of Morgan Stanley’s Chairman Club. Moldaver joined the firm last April from Bear Stearns, according to FINRA filings.
This is a big career change for Chrebet, 36, who played 11 seasons in the NFL. He holds an undergraduate degree in criminal justice from Hofstra University. Chrebet and Moldaver are both active in the local community through their charity work in low-income neighborhoods.
“We are extremely pleased that Wayne has joined Morgan Stanley, said Christopher Shaw, Morgan Stanley’s Red Bank complex manager. “Wayne is well known and respected in our local community and throughout the NFL, and is a valued addition to our team.”
Thats it! ManU is dead.
#149 Rob,
You are welcome. Thanks for the info. on what under 500s are getting – around 93%. I’d like to wait, but have a 5 year old who is starting 1st grade -so would like to start him in new school from Day 1 vs. pull him out in middle of year. But my wife and I are willing to wait if we feel it is in our family’s best financial interest.
Best of luck to you as well.
I wouldn’t by stocks that Lenny Dykstra recommended and I am sure as heck not going to buy stocks recommended my Mr. Concussion himself Wayne Chrebet.
Former New York Jets wide receiver Wayne Chrebet has joined Morgan Stanley’s office in Red Bank, N.J., as a financial advisor.
Oh no. I can see it now; the poorly acted, low-budget, local car dealership style commercial with Wayne Chrebet awkwardly reading a cheesy script “Don’t let those other fools “sack” your investment portfolio, score a “touchdown” [awkwardly putting his arms in the air to signal a touchdown] with Wayne Chrebet and the team here at Morgan Stanley”.
The end is nigh……IRS Tax Cheat Style
IRS Agent Refuses Pizza Bribe
By WebCPA
May 27, 2009
¦Advertisement
A Texas restaurant owner has been sentenced to two years in jail after he was convicted of trying to bribe an IRS agent by offering her free pizza and a job.
Ramesh G. Khilnani, 51, a Houston-area resident and a native of India, offered pizza and “work” to an IRS agent in February 2008 after an audit of his business showed that he owed $49,000 in back taxes for the years 2004 to 2007. The auditor, suspecting she was being offered a bribe, reported the incident to her supervisor.
Agents from the Treasury Inspector General for Tax Administration arranged for the recording of subsequent meetings – via telephone and in person – between the agent and Khilnani. During the course of these contacts, Khilnani offered the agent $2,500 and delivered $2,000 in exchange for having his tax liability reduced from $49,000 to around $500. In addition to financial compensation, Khilnani repeatedly offered the agent pizza from his restaurant as part of the deal.
Khilnani pleaded guilty and was convicted of bribery of a public official. U.S. District Judge Ewing Werlein Jr. sentenced Khilnani to 24 months in federal prison for bribery of a public official. He has been in federal custody since his arrest in October 2008 and will remain in custody to serve his sentence.
Khilnani is a citizen of India and has no legal status in the U.S., according to prosecutors, and he is subject to deportation upon completion of his prison term.
RentinginNJ says:
May 27, 2009 at 4:21 pm
Former New York Jets wide receiver Wayne Chrebet has joined Morgan Stanley’s office in Red Bank, N.J., as a financial advisor.
THIS IS DOWN THE STREET FROM MY OFFICE :(
Shoulda’ tried to close the deal at a third of the liability and passed on the pies.
grim: Spam alert @ 171. Do Not Be Fooled By This Cr@p. I delete a ton of this stuff every day from my blog comments.
Sean says:
May 27, 2009 at 4:20 pm
I wouldn’t by stocks that Lenny Dykstra recommended and I am sure as heck not going to buy stocks recommended my Mr. Concussion himself Wayne Chrebet.
S: Yeah, but he was awesome…
Clot,
while paid-off media shills cheer the whole scurvy operation, calling it genius when what it all really equals is sheer madness.
I am waiting for this response from the MSM, or Obama perhaps
http://www.youtube.com/watch?v=-qR0Uke2XNI
#203
Tosh..
Regarding using dollars to buy down the long-end of the curve.
“The market can stay irrational longer than you can stay solvent”
Can certainly apply to governments as well.
Look no further than the countries that have gone bankrupt attempting to defend their currencies. Seemed like such a good idea in retrospect. Then again, we’re already bankrupt. Maybe we can get the IMF to step in? The Bananafication would be complete.
Kettle, This research looks too familiar, is this you? if so, congrats on getting published buddy. Keep up the good work.
Wired-o-Nomics: Why Is the Real Jobless Number So Elusive?
http://www.wired.com/epicenter/2009/05/jobless-quants/
Veto that,
You must have not been around when Kettle1 announced that he had been published in Wired a day or two ago. Good eye though!
Chifi: Chrebet can’t be worse than Sam Waterston from Law & Order doing TD Ameritrade commercials. Why would anyone take financial advice from an actor? Sort of like taking Athlete’s Foot advice from an overweight and over the hill football broadcaster. American’s really are stupid. Perhaps this is why I have a soft side for illegal immigrants?
Sean, my man, here’s the rub…did the fi-pros really do any better over the last ten years?
I might’ve listened to a musclemanface..and may have gotten lucky.
Thank heavens I manage my family’s investments. Had I listed to my [insert financial firm alpha symbol] guy I’d be WORKING RIGHT NOW instead of getting ready to take my daughter to swim team.
Of course, there’s always the boredom. Had I listened to the fi-guys, I wouldn’t be trying to find things to occupy my brain.
yeah i missed it stu, sorry for the old news.
Pequot Capital winding down reports CNBC.
Green SHOOOOOOOOOOOOOOOOOTTTTTTSSSSS!!!!!
Clotpoll says:
I think Dunellen is the US home office for alcoholics.
The place we are going to (attorney review done; interest rate locked; home inspection done)… has its mailing address as Dunellen (though it is in a different township [green brook twp] and in different county — somerset vs middlesex).
Since I don’t drink (yet), I’ll be a virtual drunk :)
S
My step-father’s son-in-law laid off from Nokia subsidiary in Central NJ……..
Green SHOOOOOOOOOOOOOOOOOTTTTTTSSSSS!!!!!
Nothing spells investment knowledge like Football + Criminal Justice.
Also, given the NFL compensation, were this guy an investment pro he would not need to take a job working for someone else.
Quick question for the playaz on the board.
Why are condos outperforming by such a wide gap on a relative basis vs. all the housing tiers?
I mean appreciation was similar, taxes sux (including maintenance costs) and people are never going that cash back (sunk cost forever). Yet condos only down -10%.
Booya,
Perhaps people are simply sick of mowing their lawns and are willing to pay a premium for this privilege.
Read into it what you will:
6-12minths ago had gone to three gold companies for shiny (through a wholesale biz contact). Made small buy.
Other 2 had minimums too rich for our blood.
Both of those called within the last 2 weeks. They selling high because they know something we don’t?
chi (211)-
Wow. A guy whose brain probably looks like a dozen eggs dropped on a supermarket floor, paired with a Bear Stearns guy.
A dream team, indeed.
Kinda like Barca. I feel bad for doubting them. Clearly superior to Man U.
sean (214)-
I think Dykstra’s specialty was deep-in-the-money calls.
Too bad he stole all his picks from other advisors.
Maybe MS hired Chrebet to hand out the free toasters to people who open Christmas Club accounts.
sastry (229)-
Lots of Green Brook has a Dungellen zip code.
Big difference, though.
This guy seems to have the right plan.
Reallty Trac has foreclosed houses sold of March 2008 VS March 2009 of 68,360. They have new foreclosures of 342,035 from March 2009 to April 2009. Now my thoughts on buying a house right now would not be great. Even if I am saving a percentage point or two on a mortgage rate I stand to lose another 20-30% of my home value as it is plain to see that it has not bottomed. With the Banks servicing mortgages instead of putting them on the markets to keep the pricing inflated, aligned with job losses mounting can have only a further negitive effect on house prices. Now my thoughts are that the Fed is going to be reluctant to raise interest rates in the future in order to control inflation, if a person was patient and waited until the perfect combination of the bottom of the house market in a year or so and and catch the interest rate before it rockets off. You would have yourself the best of both worlds and a grand entry point. Just a thought.
Speaking of Dunelen and Bound Brook and doing, in all good humor, and in the spirit of John (no offense intended):
“Yea, I Dunellen and Bound Brook in the same night in the back of my dad’s limo while he drive a smashed Ted Kennedy to the airport.”
May 27 (Bloomberg) — The U.S. economy will enter “hyperinflation” approaching the levels in Zimbabwe because the Federal Reserve will be reluctant to raise interest rates, investor Marc Faber said.
Prices may increase at rates “close to” Zimbabwe’s gains, Faber said in an interview with Bloomberg Television in Hong Kong. Zimbabwe’s inflation rate reached 231 million percent in July, the last annual rate published by the statistics office.
“I am 100 percent sure that the U.S. will go into hyperinflation,” Faber said. “The problem with government debt growing so much is that when the time will come and the Fed should increase interest rates, they will be very reluctant to do so and so inflation will start to accelerate.”
Apologies if this was posted already.
http://blogs.wsj.com/developments/2009/05/26/home-prices-significantly-undervalued-should-renters-buy/
WSJ – May 26, 2009, 10:42 AM ET.
Home Prices ‘Significantly Undervalued,’ Should Renters Buy?
Case-Shiller home price index shows that house prices haven’t hit a bottom, and they’ve fallen so far—another 7.5% in the first quarter from the previous quarter—that house prices are “now undervalued, possibly quite significantly,” writes Paul Dales, U.S. economist for Capital Economics. That’s raising an interesting question for potential buyers who’ve rented throughout the housing boom: Is it time to buy?
Home prices have returned to 2002 levels in nominal terms and to 2000 levels when adjusted for inflation. Looking at the historic ratio of home prices to rental prices, home prices are now 9% below the normal market value, the lowest since 1999. And using the measure of home prices to incomes, housing is 18% below its historical level, according to Capital Economics, the lowest such ratio since the Case-Shiller index began measuring prices 22 years ago.
Some markets have posted even sharper retreats. Prices in Detroit have fallen to their 1995 levels, according to housing analyst Ivy Zelman, the largest such drop among the 20 cities tracked by the Case-Shiller index, while Cleveland has returned to 1999 prices.
But buyers may hold back because there’s no sign that prices won’t keep falling. Rising unemployment could push values down, as could a rising shadow supply of foreclosed, vacant and unlisted homes. Economists have long expressed concern about prices overshooting on the downside, or falling below the point at which they’d return to equilibrium. Mr. Dales estimates another 5-10% decline in prices.
Rents, meanwhile, continue to fall, too, which helps balance the scales a bit in favor of those who continue to rent. While the buy-or-rent dynamics vary drastically from market to market, we’re curious if there are any readers who think now’s the time to make the jump from renting to owning.
What type of inflation? “Too many dollars chasing too few goods”…don’t think many of us are bidding on goods with extra cash we all have.
Commodity based inflation due to devalued dollar, maybe. High interest rates, probably.
Thoughts?
re:245 Condo – deflation is sailing away after it left a crap load of debt on the docks. Just watch oil….
Zimbabwe called and the Huffington post answered.
“The global financial and economic crisis arose out of radical deflation in the U.S. housing market, as the real estate asset bubble split asunder. With the collapse in housing prices came the contraction of another asset bubble: equities. The ongoing demand destruction has also deflated commodity prices from their recent peaks, giving rise to a collective view among economic policymakers that deflation represents the single greatest risk to the global economy.”
http://www.huffingtonpost.com/sheldon-filger/us-economy-risks-dire-pro_b_207079.html?ref=housingbubblenews.com
“What type of inflation?”
[245],
Green Shoots Inflation;
http://charts3.barchart.com/chart.asp?sym=CIY0&data=A&jav=adv&vol=Y&divd=Y&evnt=adv&grid=Y&code=BSTK&org=stk&fix=
what is everyone’s take on the direction of mrtg rates? i hear that its up to over 5% for 30year fixed and going to rise?
suggestions? comments?
Sean 247
This will not end well. To live in interesting times, to say the least.
CAIBC See post 241.