
The New Jersey Home Price Index Tracker has been updated to include:
* June S&P Case Shiller (Aggregate, Tiered, Condo)
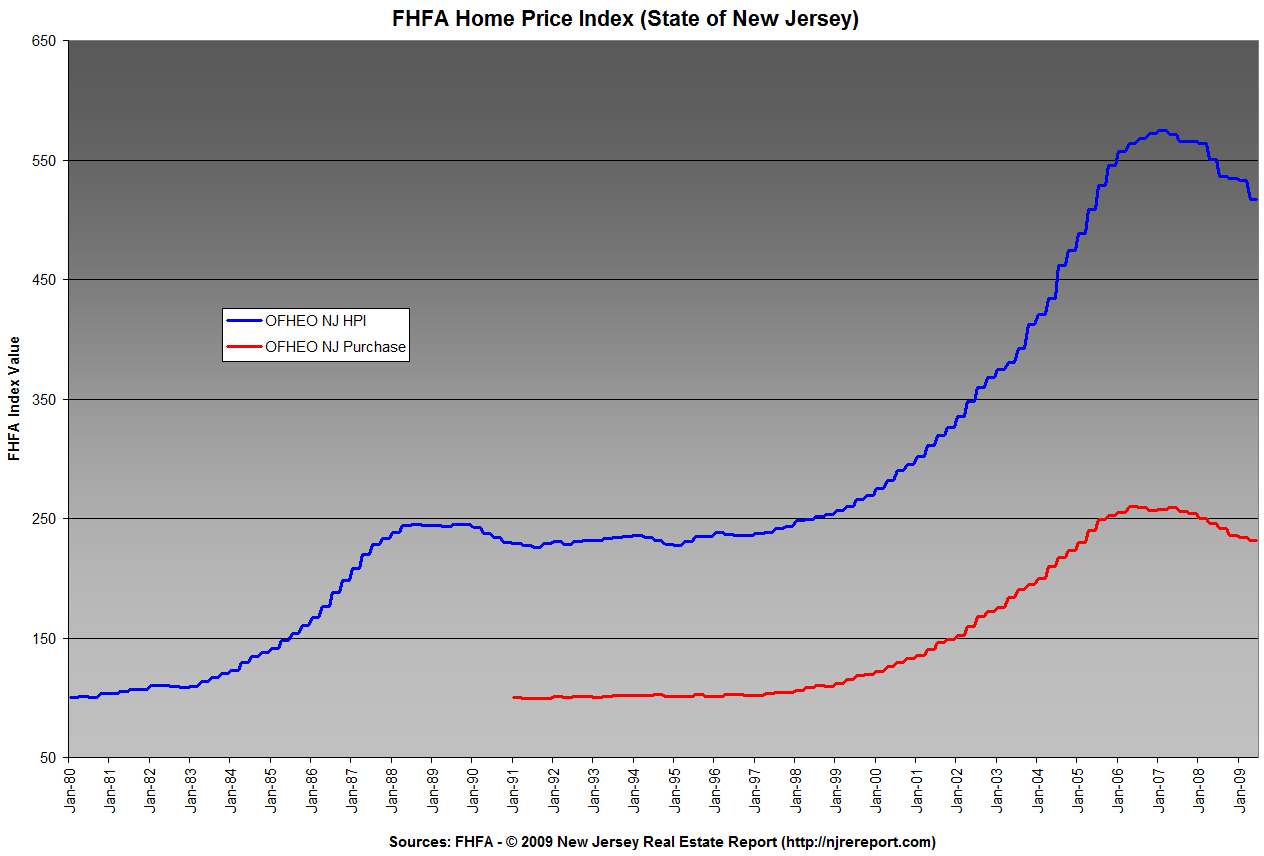
* Q2 FHFA Home Price Index (HPI, Purchase Only)
(click to enlarge)
(click to enlarge)
(click to enlarge)
FHFA (Formerly known as the OFHEO) Home Price Index
HPI (Includes Refis) – Peaked in Q1 2007 and is down 10.02% from peak
Purchase Only – Peaked in Q2 2006 and is down 11.16% from peak
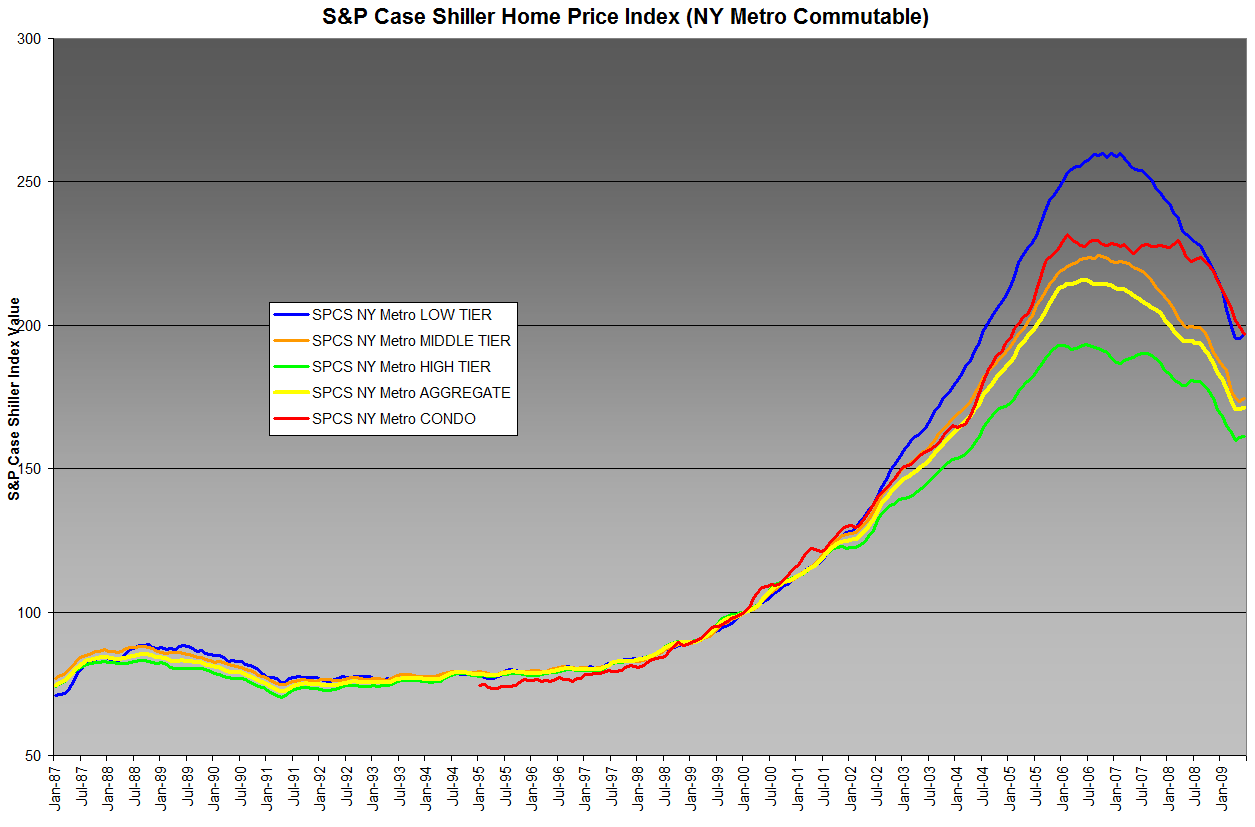
S&P Case Shiller NY Metro Commutable Area Home Price Index
Low Tier (Under $284606) – Peaked in October 2006 and is down 24.26% from peak
Mid Tier ($284606 – $417722) – Peaked in September 2006 and is down 22.14% from peak
High Tier (Over $417722) – Peaked in June 2006 and is down 16.51% from peak
Aggregate (Overall Market) – Peaked in June 2006 and is down 20.54% from peak
Condo-Only Index – Peaked in February 2006 and is down 15.07% from peak
NY Metro Area Aggregate Year over Year Changes
Jun 08 -7.04%
Jul 08 -7.04%
Aug 08 -6.61%
Sep 08 -7.13%
Oct 08 -7.72%
Nov 08 -8.73%
Dec 08 -9.21%
Jan 09 -9.72%
Feb 09 -10.33%
Mar 09 -11.69%
Apr 09 -12.44%
May 09 -12.07%
Jun 09 -11.94%
From the Record:
Home prices in region showing signs of stabilizing
Home prices in the New York metropolitan area, which includes North Jersey, show signs of stabilizing, according to the Standard & Poor’s/Case-Shiller home index, released this morning.
The region’s home values in June were 11.9 percent below where they were in June 2008, but they dropped only 0.4 percent from May to June, a smaller rate of decline than was seen earlier this year.
National home prices, while down about 15 percent year over year, actually increased slightly from May to June. National home prices are about 30 percent below the market peak in mid-2006, and are back to the levels of early 2003.
“For the second month in a row, we’re seeing some positive signs,” said David M. Blitzer, chairman of the index committee at Standard & Poor’s. “There are hints of an upward turn from a bottom.”
Sorry folks, was out of contact all day today.
I missed U Grim…..*Sniff*
Nice charts Grim as always.
It’s fairly obvious. The bottom is in. I expect a V shaped recovery starting tomorrow.
It’s fairly obvious. The bottom is in. I expect a V shaped recovery starting tomorrow.
Started months ago, you missed the bottom. You’ll be living out of the back of your Honda sucker.
P.S. Don’t forget to feed the squirrels.
Did Nom Deplume author this piece?
Will the United States Default?
by Arnold King
Someone asked for my comments on the Jeffrey Rogers Hummel piece. I think that the U.S. government would enact a wealth tax rather than default on its debt. Other countries that have defaulted have not had the option of enacting wealth taxes. When you are in a banana republic with shaky government finances and you have a lot of wealth, you send that wealth over to the United States, where your government cannot get to it. That “safe haven” motive is what keeps the dollar so strong.
http://econlog.econlib.org/archives/2009/08/will_the_united.html
grim, I guessed you missed Sue Adler’s friend Krisstina (yes, two S’s) letting everyone know the bottom is in. Interest rates AND home prices are at all time lows. Dude, get on top of things will you?
Your charts are all up up up from here.
grim
any chance of price : rent for NJ? great charts as always. it seems to me you still can’t buy a house w/ %20 down and rent it for what the mortgage would be.
As for my opinion.
I don’t think we’ve hit the bottom.
Remember that we saw something very similar in the S&P CS this same time last year:
S&P CS NY Metro Aggregate
May 08 – 194.22
Jun 08 – 194.74 (increase)
S&P CS NY Metro High Tier
Apr 08 – 178.90
May 08 – 179.00 (increase)
Jun 08 – 180.61 (increase)
S&P CS NY Metro Mid Tier
May 08 – 199.22
Jun 08 – 199.51 (increase)
Jul 08 – 199.07 (decrease)
Aug 08 – 199.39 (increase)
Next GTG in ireland? we can do a RE tour!
Irish real estate values to plunge by 50% as property crash worsens
The price of the average house in Ireland is set to drop by nearly 50 percent from their eye-popping peaks. New figures from Ulster Bank show that housing prices have already dropped by 35 percent and another 10 percent is expected through the end of 2010. Mind you, that’s a conservative estimate from the lending side of the equation, who clearly want to see an improvement soon. But developers fear it will be even worse. They say the value of development and commercial land will drop by about 70 percent which will push the house prices down even further. “What’s happening here,” said one developer, “is that people like me bought land at the peak with the idea of selling $500,000 apartments.”
http://www.irishcentral.com/news/Irish-real-estate-values-to-plunge-by-50-percent-53797502.html?ref=patrick.net
As for the performance of condos, it appears that the situation continues to worsen hitting the worst mark yet this down cycle.
S&P CS NY Metro Condo Index YOY Change
Jan 09 -6.61%
Feb 09 -8.14%
Mar 09 -10.39%
Apr 09 -11.08%
May 09 -10.75%
Jun 09 -11.56%
There has been no improvement in the index value:
S&P CS NY Metro Condo Index
Jan 09 – 212.2427
Feb 09 – 209.45301
Mar 09 – 205.74876
Apr 09 – 201.54741
May 09 – 199.58439
Jun 09 – 196.64058
Surprisingly absent is John’s comment about Krissssstina’s bottom. Not like him to miss out on an opportunity like that. Likely busy at some fabulous party up in the Hamptons.
http://news.yahoo.com/s/ap/20090824/ap_on_re_us/us_ri_government_shutdown
RI gov to shut down state government for 12 days
Have a nice vacation folks.
From Bloomberg:
NYC Apartment Rents Fall as Tenants Gain Leverage
Manhattan apartment rents fell as much as 10 percent in August from a year ago as tenants gained negotiating power in the recession and forced landlords to offer concessions.
In buildings attended by doormen, rents on one-bedroom apartments dropped 10 percent from a year earlier to an average of $3,274 a month, according to a report by the Real Estate Group of New York. Studio prices fell 7 percent at those properties to $2,329 and two-bedrooms declined almost 6.9 percent to $5,161. Soho and TriBeCa were the most expensive neighborhoods.
Rents in Manhattan are falling as unemployment climbs. The number of job seekers rose to 402,200 in July, the most since 1992, New York City’s Comptroller William Thompson said yesterday. Landlords are offering incentives such as free rent and paying brokerage fees to lure tenants, said Daniel Baum, chief executive officer of the Real Estate Group.
“The concessions out there right now are pretty aggressive,” he said.
The city’s unemployment rate climbed to a 12-year high of 9.6 percent in July even as the national rate ticked down to 9.4 percent. The U.S. economy has lost 6.7 million jobs since the recession began in December 2007, making it the biggest employment slump in the last eight decades. Economists surveyed by Bloomberg predict the unemployment rate will reach 10 percent by early next year.
I missed U Grim…..*Sniff*
I know, terrible, I’m usually on top of it on such important data days.
Must have missed the ChiFi slacker comment as well.
Just a little more detail:
S&P CS NY Metro Aggregate
May 08 – 194.22
Jun 08 – 194.74 0.27% Increase
May 09 – 170.77
Jun 09 – 171.49 0.42% Increase
And yet some more..
Like I said, we saw similar behavior last year. Take a look at the year over year change in the aggregate index over last Spring into Summer.
S&P CS NY Metro Aggregate YOY Change
Apr 08 -7.98%
May 08 -7.74%
Jun 08 -7.04%
Jul 08 -7.04%
Aug 08 -6.61%
This clearly shows improvement in the second derivative, a slow down in the rate of decline, as we moved into Summer.
However, once we passed through August, the market regained downward momentum.
Sep 08 -7.13%
Oct 08 -7.72%
Nov 08 -8.73%
Dec 08 -9.21%
Jan 09 -9.72%
Feb 09 -10.33%
Mar 09 -11.69%
Apr 09 -12.44%
[6] black
No, but I could have, except for the observation about assymetry. Parking the 7th Fleet off of the Channel Islands isn’t going to change their banking laws. Send the Marines ashore, and what do they seize? A lot of empty banks and that’s it.
[10] kettle,
You once wanted to know a good site for an offshore Nompound. Ireland is on the short list, and wasn’t attractive initially because of land values. This will help.
In fact, for the truly wealthy, Ireland is one of the top countries, if not THE top country, where the wealthy have their nompounds.
Grim,
I can’t but help wonder if the passage of a well-timed 15k tax credit with no income restrictions could help prevent or perhaps turn the tide on the usual downward trend that occurs starting in September?
Hmm…
Based on the recent media, raising the credit at this point may be a politically difficult sell.
Nom 19
Time to go castle shopping? Will need granite in the dungeon and marble for the dining hall though.
Of course the bottom is in . Everyone knows it.Buy Buy Buy, Sheep , Sheep Sheep.
The Next Bubble- California Dreamin’
http://vegasandre.wordpress.com/2009/08/23/the-next-bubble-california-dreamin/
Nom
For Sale By Owner
Dramatic Price Reduction
2,700,000 €2,150,000 €
http://www.castleffrench.com/
#24 – When the put the castle Aaargh! up for sale let me know.
Where do people here see mortgage rates going over the next few weeks? Stable? Higher? Lower?
Nom,
A castle for every budget ;)
http://www.premierpropertiesireland.com/
So 950,000 Euro’s = about 1.35 million USD
what 1.35 million buys you ireland:
Glanmore Castle
http://www.premierpropertiesireland.com/
Magnificent 18th Century Castle on the Grounds of Devils Glen Equestrian Village Private Elevated Site with Panoramic Views;Castellated Turret C.2,000 sq.ft.; Superb Prestigious Location 28 Miles South of Dublin City Centre; Charming Country Residence whilst close to Dublin Glorious Setting in Wicklow Countryside; Steeped in History Formerly owned by the Synge Family notably the writer John Millington Synge
what 1.35 million buys you in NJ:
West field NJ
http://www.realtor.com/realestateandhomes-detail/Westfield-Twp_NJ_07090_1108587555
Elegant home nestled on a private lot on the bend on Highland Avenue. Beautifully appointed thru out including a Liv Rm w/fplc; FDR; Kit w/brfkst bar; Fam Rm & Sun Room & more!
[29] kettle
Delusional. One bed less than my house and just as far away from the train. I don’t feel so bad about overpaying anymore.
From the Record:
Bankruptcy filing leaves home buyers, refinancers scrambling
The collapse of Taylor, Bean & Whitaker Mortgage Corp., a large Florida-based mortgage company, has left some North Jersey home buyers and refinancers scrambling for new loans.
The Ocala company filed for bankruptcy protection this week, a few weeks after the FBI raided the company’s headquarters and the Federal Housing Authority suspended its authority to issue FHA loans. That decision halted Taylor Bean’s lending operations, leaving home buyers and refinancers in the lurch.
Anne and James Mould were told just days before their scheduled Aug. 10 closing on a house in Rutherford that their Taylor Bean mortgage had disappeared.
“Utter shock” was their reaction, said Anne Mould.
“The emotional turmoil of not knowing whether it was going to go through or not was upsetting,” she added.
The Moulds’ mortgage broker, Michael Favor of 3rd Generation Mortgages in Bayville, was able to find another lender for the couple, and they closed on their home Aug. 18, just over a week after their original closing date.
“There was no way to foresee that a multi-billion-dollar company was going to shut down overnight,” said Favor. His company is moving a number of clients who had applied for loans with Taylor Bean to other lenders, he said. In many cases, it is costing 3rd Generation money because the broker is honoring the interest rates the clients thought they had locked in with Taylor Bean, even though in some cases rates have risen in the meantime. In addition, Favor said, 3rd Generation is paying for the new appraisals required by the new lenders.
Steve Graber, president of Pan Am Mortgage in Saddle Brook, said he had a client who was about to close on a $715,000 refinancing when Taylor Bean abruptly shut down lending.
“All of a sudden we got a notice that they’re out of business and not funding anything,” Graber said. “I had one very disappointed customer.”
Marc Schwartz of Globe Mortgage America in Englewood said his company was in the process of selling loans to Taylor Bean when the company ceased operations. In those cases, the borrowers already got their money from Globe; now Globe must find another buyer for the loans.
From the AP:
Most red ink ever: $9 trillion over next decade
In a chilling forecast, the White House is predicting a 10-year federal deficit of $9 trillion — more than the sum of all previous deficits since America’s founding. And it says by the next decade’s end the national debt will equal three-quarters of the entire U.S. economy.
[32] grim
I really must start on my girls’ citizenship applications to another country. I like that castle, and Ireland appeals to ancestry, so maybe that’s it.
And since the future disbursements from their trusts will be payment for art works, it should be exempt from Irish taxation.
http://www.revenue.ie/en/tax/it/reliefs/artists-exemption.html
[32] grim
and in a related development:
“White House Forecasts Sharp Increase in Spending on Low-Income Tax Credits
Posted August 25, 2009, 6:58 P.M. ET
The sagging economy is expected to push more individuals into income levels that allow them to qualify for programs such as the earned income tax credit, dramatically increasing the cost of recent expansions of those credits, the White House Office of Management and Budget said Aug. 25.
In its mid-session review, OMB noted that total federal spending on seven refundable tax credits—including the Child Tax Credit—would rise $34 billion over the next 10 years due to economic conditions, and revisions were made to both cost estimates and the administration policy proposals as a result.
Meanwhile, both OMB and the Congressional Budget Office, which issued its own mid-year budget update on Aug. 25, said the federal government’s tax receipts for fiscal year 2009 would be the lowest on record since 1950.
OMB said tax receipts for fiscal 2009 are projected to equal 14.7 percent of the total value of all goods and services produced in the United States, far below the average of 18.3 percent posted over the past 40 years.”
I’m not sure how much more Hope and Change I can afford.
And how about this for CHANGE. Wow. I mean wow.
“Mercer Says 2009 Economic Activity Could Lower Retirement Plan Limits in 2010
Posted August 25, 2009, 6:58 P.M. ET
Employers should be aware of the possibility of lower limits on contributions to qualified retirement plans, the New York consulting firm Mercer said in an analysis released Aug. 25.
The Internal Revenue Service is expected to announce retirement plan limits for 2010 Oct. 15, the same day that the Bureau of Labor Statistics releases the Consumer Price Index for urban consumers. Before that date, however, employers and their counsel should be prepared for the possibility of lower limits that could trigger a requirement under tax code Section 204(h) to notify participants in defined benefit and cash balance plans of the change, Mercer said.
If inflation remains at recent low levels, IRS might lower the retirement plan limits or leave the current limits in effect, according to the analysis report, Lower 2010 401(k), pension plan limits could challenge efforts to rebuild nest eggs. “It’s unclear whether IRS will interpret the law as requiring these limits to decrease if recent inflationary patterns continue into September,” the report said.”
Why would IRS lower the ceiling on contributions? There’s only one plausible reason, and it is to increase revenues. By capping contributions (which will inure disproportionately to us “wealthy”), it increases tax revenues. Of course it also makes it more likely that you will save less and rely on Uncle Sucker more in the future, but hey, that way you will have drunk the Kool-aid and become one of us.
Oh, and about that “I will not raise your taxes one dime” speech, he meant the marginal income tax rates. Said nothing about raising your overall tax burden, did he?
Nom,
I would be interested in what the tax comparison would be between the Brigadoon example in 29 and the Irish castle in 28.
I am willing to bet that the difference is small and possibly in favor of the irish castle. My guess is that the long term outlook is definitely in favor of the irish castle.
Grim,
Death of the Burbs under way. How long until we see re-urbanization begin…
US suburbs become face of foreclosure
Apart from the piece of paper in the window, the house looks like every other Midwest suburban home in the Lakewood Springs development in Plano, a small town about 50 miles west of downtown Chicago. But the sign makes clear that the house has been repossessed by a local mortgage lender and warns against trespassing. Bob Hausler, Plano’s mayor, reads the notice aloud and then pauses. “People lose their jobs, then they lose their homes,” he says quietly.
What portion of Wealth Tax is needed from each Citizen to pay off the twenty two trillion in forecasted debt?
for anyone interested:
Money As Debt II: Promises Unleashed
http://www.youtube.com/watch?v=cUou51iI4vw
Another price index to add to the mix, from FirstAmerican LoanPerformance:
http://www.loanperformance.com/email/hpi/newsletter_hpi_0809.html
12-Month Change By Top CBSAs (Core Based Statistical Areas) as of June 2009
Edison-New Brunswick NJ -10.79%
New York-White Plains-Wayne NY-NJ -7.92%
Philadelphia PA -5.08%
just another of many time bombs
Millions face shrinking Social Security payments
Millions of older people face shrinking Social Security checks next year, the first time in a generation that payments would not rise. The trustees who oversee Social Security are projecting there won’t be a cost of living adjustment (COLA) for the next two years. That hasn’t happened since automatic increases were adopted in 1975. By law, Social Security benefits cannot go down. Nevertheless, monthly payments would drop for millions of people in the Medicare prescription drug program because the premiums, which often are deducted from Social Security payments, are scheduled to go up slightly.
“I will promise you, they count on that COLA,” said Barbara Kennelly, a former Democratic congresswoman from Connecticut who now heads the National Committee to Preserve Social Security and Medicare. “To some people, it might not be a big deal. But to seniors, especially with their health care costs, it is a big deal.” Cost of living adjustments are pegged to inflation, which has been negative this year, largely because energy prices are below 2008 levels. Advocates say older people still face higher prices because they spend a disproportionate amount of their income on health care, where costs rise faster than inflation. Many also have suffered from declining home values and shrinking stock portfolios just as they are relying on those assets for income.
http://news.yahoo.com/s/ap/20090823/ap_on_go_ot/us_social_security_smaller_checks;_ylt=A0LEaphKdZFKmXwBKAOs0NUE;_ylu=X3oDMTNqdTJjdnNoBGFzc2V0A2FwLzIwMDkwODIzL3VzX3NvY2lhbF9zZWN1cml0eV9zbWFsbGVyX2NoZWNrcwRjcG9zAzQEcG9zAzEEcHQDaG9tZV9jb2tlBHNlYwN5bl9oZWFkbGluZV9saXN0BHNsawNtaWxsaW9uc2ZhY2U-
http://www.bloomberg.com/apps/news?pid=20601087&sid=a7CC61ZsieV4
Aug. 25 (Bloomberg) — The Federal Reserve must for the first time identify the companies in its emergency lending programs after losing a Freedom of Information Act lawsuit.
Fire,
dont worry, GS and “friends of bernanke” have already shorted the crap out of the companies on that list.
re:#19 – “Ireland & nompound”
Always thought I would go back, so I learned how to sail, and we have a family place.
If anyone is interested I have an Aunt who is selling….
Question:
The foreclosure moratorium in california ends next month. If Cali was doing 200,000 foreclosures per week before June, then that suggests that there’s a backlog of about 2.4 million foreclosures waiting to hit next month.
Grim, clot, am i missing anything here or is this going to get interesting?????
#22 No granite in the kitchen, please. At least not the tan stuff – it looks like throw-up.
From MarketWatch:
Housing recovery or another false start?
In a teleconference Tuesday, Shiller was reluctant to call a definitive bottom in home prices, saying he’s seeing “conflicting signals” in the housing market.
On the positive side, the rise in home prices in May and June is a “sudden break in momentum” from years of nearly steady, punishing declines that may signal a turning point. “The roller coaster is now going up,” Shiller said.
Yet he noted what appeared to be a housing recovery in early 2008 “fizzled” when prices resumed their decline. And a long-term chart of home prices makes it look like “we are still in the process of a bursting bubble.” Shiller expressed “great reluctance” to forecast where prices will go from here with the U.S. economy in the midst of the most severe recession since the Great Depression.
“Unemployment looks like a bad indicator for the housing market,” Shiller said.
There are other challenges that could snuff out the nascent revival in home prices. One of the biggest threats is the mounting wave of foreclosures as more strapped borrowers struggle to meet their monthly mortgage payments. The First-time buyer tax credit is set to go away in November, and rising interest rates could also dampen sales, economists say.
Indeed, recent experience has taught homeowners that prices can be very volatile, said David Blitzer, chairman of the index committee at S&P, during Tuesday’s call.
On a national level, home prices are back to levels last seen in 2003, but the cities that saw the biggest run-ups also fell the hardest.
“The idea that they could never go down was wrong,” Blitzer said.
Yet he noted what appeared to be a housing recovery in early 2008 “fizzled” when prices resumed their decline
Sorry Chiller, I guess you get the credit for noticing the trend. See #17 above.
Mega comp killer in Ridgewood…
339 Queens Court, Ridgewood NJ
Purchased: 4/12/2007
Purchase Price: $630,000
MLS# 2708973
Current Asking Price: $459,000
27% under the 2007 purchase price
Granted this is not the most scientific poll in the world but it is REALLY DISTURBING:
34 Percent of Workers Have One Week or Less of Savings
Many people are living paycheck to paycheck, on the edge of disaster as highlighted in a new Monster Poll that reveals 34 Percent of Workers Have One Week or Less of Savings.
Over a one week period beginning July 6 and running through July 13, more than 16,000 visitors to Monster.com participated in the Monster Meter Poll question “If you were laid off without severance, how long would your savings cover your living expenses?”
http://globaleconomicanalysis.blogspot.com/2009/08/34-percent-of-workers-have-one-week-or.html
grim, thanks for posting the stats in #17.
The thing is, the MSM will remember that month-to-month numbers are not as meaningful as YOY once the Fall starts and the month-to-month housing numbers start to decline again.
At that point they will go back to quoting the YOY which will be bad, but not AS bad as previous YOY numbers and the Fed Chairman and markets will rejoice at the good news that things seem to be “improving”.
If anyone remembers back to the early days of the blog, they probably remember the “Cambridge Crossings Crazy in Clifton” post.
Comp Killer
33 Devonshire Drive, Clifton NJ
Purchased: 3/29/2006
Purchase Price: $419,900
MLS# 2645462
Sold: 8/10/2009
Sale Price: $315,000
25% under the 2006 purchase price.
More than a $100,000 loss.
And here is one for Gator and Stu, since they came out on Saturday.
9 Windermere, Montclair NJ
(Finally closed)
Purchased: 7/23/2004
Purchase Price: $650,000
MLS# 2646508
Sold: 08/13/2009
Sale Price: $457,000
30% under 2004 purchase price!
Garden State Plaza is priceless. A 14% writedown of priceless is still priceless. Where did these guys learn math? They wrote down the value of it’s 50% interest in the GSP from $724 to $625 million, I understand Bergen County is very upset about this. Is that place really worth more than a billion dollars?
Westfield Reports Loss, Cuts Dividend Payout Ratio
Westfield Group, the world’s largest owner of shopping centers by market value, reported a first-half loss after profits were wiped out by property writedowns.
The net loss was A$708 million ($591 million) in the six months ended June 30, compared with a profit of A$1.29 billion a year earlier, the Sydney-based company said today in a statement. Westfield’s operating earnings rose 12 percent to A$1.04 billion.
Doh!
Anheuser-Busch, MillerCoors: price hikes in fall
http://finance.yahoo.com/news/AnheuserBusch-MillerCoors-apf-2073507772.html?x=0&sec=topStories&pos=4&asset=&ccode=
“The nation’s top brewers said Tuesday they plan to raise prices this fall, even as some of their top brands are seeing sales volume drop.
Anheuser-Busch, maker of Bud Light and Budweiser, and MillerCoors, maker of Blue Moon and Miller Light, both say they’re going to raise prices.”
Thanks, Grim? It is a pretty terrible location right near the Northeast school, but a 30% drop in Upper Montclair is pretty impressive!
Why did renters previously have more health issues than homeowners?
http://www.concordmonitor.com/apps/pbcs.dll/article?AID=/20090825/FRONTPAGE/908250356
grim (12)-
Is the “Hamptons” some sort of beater bar in Belmar?
grim (31)-
We’re now catching the fallout from a lot of shysters who picked up Taylor Bean deals that fell out of their pipeline. Lots of borrowers all over NJ have closing dates imminent (or, already missed) and loans that won’t/can’t fund.
Green shoots, dude.
vodka (45)-
My vote is on the “interesting” choice.
“grim says:
August 25, 2009 at 9:05 pm
If anyone remembers back to the early days of the blog, they probably remember the ‘Cambridge Crossings Crazy in Clifton’ post.”
I remember that day vividly. You declared, “housing prices in Northern NJ will fall upwards of 40% in the next 5 years.” To date, New York area prices have fallen – wait for it – 16% according to Shiller. Njrereport nation awaits your updated forecast.
By the way, the Garden State Plaza is worth a billion on a really bad day. A California company sold a 50% interest in a smaller, crappier mall in Queens for $325 million a couple of weeks ago, implying that a 100% controlling interest is worth at least $650 million. The California company bought the place for less than $100 million in the 1990s.
69 Beach Bum/76 Tosh previous thread. apologies if already answered. A sheriff sale will extinguish all mortgages & liens junior to that of the plaintiff, that have been named in the foreclosure complaint. The proceeds raised through the sheriff sale will be used by the sheriff to satisfy the plaintiff’s foreclosure judgment. If no excess funds are available the junior creditors go scratch. Clear title can pass after the sale. Municipal tax liens will survive the foreclosure sale.
Beach, you mentioned you were overseas I think. Buying at a foreclosure sale is risky even when the bidder is here in the in the county of venue. To buy sight unseen through a proxy would be a huge risk.
Not all realtors/agents/brokers are equal when it comes to navigating a short sale. Many do not have the stamina it takes to provide the foreclosing lenders w/ multiple requests for financial info & then waiting months for a response.
WASHINGTON – In a chilling forecast, the White House is predicting a 10-year federal deficit of $9 trillion — more than the sum of all previous deficits since America’s founding. And it says by the next decade’s end the national debt will equal three-quarters of the entire U.S. economy.
Luckily it won’t effect the Stock Market or Standard of Living.
Fear not “Fence Sitters” we are now in the “The Buying Zone” as determined by the “Housing V”:
Analysis of our New Jersey Housing Market
August 20th, 2009 by Sue Adler
http://njexperts.com/2009/08/20/analysis-of-our-new-jersey-housing-market/
bottom?
recovery.
Its game over. Jig is up. Its already collapsed. Its a orderly & controlled collapse.
Question is whom is doing the trasfer and where?
SAS
9 trillion?
how many wars will there have to be to cover that price tag?
how much global taxation will the little man take before he gives the USA the finger in the form of terrorism?
SAS
but don’t worry, there is plenty of methylmercury & atrazine
for everyone to go round.
so, drink & eat.
SAS
and your going to escape NJ by moving to PA?
“Pennsylvania budget impasse takes toll on residents
As battle rages over Pennsylvania budget months overdue, residents lose vital services. Social service programs are among the first to go”
http://money.cnn.com/2009/08/24/news/economy/Pennsylvania_budget_impasse/index.htm
aw.
http://www.zerohedge.com/article/westfield-results-demonstrate-decline-us-mall-market
sl
http://www.zerohedge.com/article/giethner-fed-audit-would-be-problematic-country
so fuLLLLLLLLLLL on BS
CNN reporting that Ted Kennedy has died.
Wonder what he’ll say to Mary Jo?
Nom, 71
And their unborn kid, too.
sl
[36]kettle
my latest angle is this. Canada. If one can relo a business there, then you can get canadian citizenship, but keep your other assets in the caribbean.
Reason is this. Unless they changed their law, Canada taxes you based on income earned in Canada. Once you get your canadian citizenship, say hasta la vista to the US (the matter of handling the money in the caribbean is handled through what I call an “alley-oop” trust, probably in the form of a bermuda special purpose trust). Then you beat feet out of Canada with your canadian passport, and leave a forwarding address of Belize or someplace warm. You can even spend 180 days each year in the US if you miss the family (but no more–one day over and they take a meataxe to your wallet).
This way, you can see the world, pay zero taxes on your retirement distributions and current earnings, and thumb your nose at Chairman O and his politburo (which just got lighter by one member tonight).
Today, property owners are the bagholders. Tomorrow, it will be U.S. citizens.
Nom,
better work on my french….
Years ago, when I was living back in Mass., in a conservative, blue collar town, Hirohito died. The local paper ran the story on the front page with a headline “Emperor Hirohito, Dead at XX. Joins Hitler in Hell.”
They really printed that. I wonder if any news outlet will have the cojones to trash Kennedy in similar fashion. I sincerely doubt it, and you will see him lionized.
One good thing is maybe, just maybe, Mass. can finally get out of that Kennedy stupor it has been in for 4 decades. Maybe they will piss the Kool-aid out of their system, especially since the current crop of Kennedys is more fcuked up than their parents were. I know, I have met a lot of them, and we are all safer with them out of politics (or off the road).
[74] kettle
WTF are you doing up???? No need since they need engineers in Alberta and BC as well.
I remember that day vividly. You declared, “housing prices in Northern NJ will fall upwards of 40% in the next 5 years.” To date, New York area prices have fallen – wait for it – 16% according to Shiller. Njrereport nation awaits your updated forecast.
I must have been having a particularly bad day, I didn’t think I ever went more grim than a 30% off peak call. My call is 30% off peak prices.
Anyhow…
To date, NY area home prices are down 20.54%, not 16%.
S&P Case Shiller NY Metro Aggregate
June 2006 – 215.83
June 2009 – 171.49 (-20.54%)
And I’ll repost some recent Cambridge Crossings comps:
33 Devonshire, Clifton NJ
Purchased: 3/29/2006
Purchase Price: $419,900
MLS# 2645462
Sold: 8/10/2009
Sale Price: $315,000
25% under the 2006 purchase price.
173 George Russell, Clifton NJ
Purchased: 3/17/2005
Purchase Price: $494,900
MLS# 2629246
Sold: 8/17/2009
Sale Price: $395,000
20% under the 2005 purchase price.
And if you want to compare like units..
163 Brittany
Purchased: 1/5/2005
Purchase Price: $495,000
Assessed at $9681
175 Brittany
Sold: 5/20/2009
Sale Price: $365,000
Assessed at $9591
(26% off)
Or even an asking price to sale price comparison over this period
35 Barrister, Clifton NJ
Listed: 7/11/2005
Asking Price: $513,528
Sold: 6/25/2009
Sale Price: $376,000
(27% off the original ask)
What was your forecast? I got the direction correct as well as the velocity (roughly 7% a year, or 22% to date, is approximately 40% over 5 years.) Can’t say whether or not the call was right or wrong unless we’re going to wait out the balance of those 5 years. Look, I’d admit that I was a bit naive, and didn’t think for one minute that the Federal Government would go to the extent it did to try to put a floor under home prices, something that wasn’t taken into account in any of my prior forecasts.
Again, what was your forecast?
From the Press of AC:
47,000 in New Jersey could lose unemployment benefits in December
Without warning, Zona Johnson was downsized from her job as an administrative assistant early last year, forcing her to go on the unemployment rolls for the first time in her life, she said.
Still jobless, the 44-year-old Mays Landing woman says her COBRA health insurance plan will end next month and she will have exhausted her unemployment insurance by year’s end.
“It’s been very frustrating,” Johnson said Tuesday. “You look over your bills, and you worry.”
About 1.5 million people nationwide – and more than 47,000 New Jerseyans – could receive their last unemployment checks at the end of the year without further federal funding, according to a recent analysis by the National Employment Law Project, an advocacy group in New York.
Currently, unemployment benefits are available to qualifying workers for as many as 79 weeks – the longest period of time since the federal unemployment insurance program was established in 1935. But some lawmakers are pushing to do more, and Congress this fall may consider bills that would extend unemployment insurance another 13 weeks in states with high jobless rates.
New Jersey stands to benefit. Its unemployment rate increased to 9.3 percent in July, its highest level in 32 years.
grim:
do the valley heights comps.
Green shoots.
“On tall windows up and down Walnut Street – the luminous shopping district that is Philadelphia’s mini-Madison Avenue – two words are spreading like chicken pox these days:
“For Lease.”
The recession has provoked a reversal of fortune for a glitzy avenue near the towering new condos and old-money brownstones that embody exclusivity in Center City. Retail landlords who commanded top-dollar leases just a few years ago are scrounging for wealthy suitors.
A dozen retail properties on a 41/2-block stretch of Walnut west of Broad Street – banks, two marquee restaurants, a jeweler, chain boutiques – are shuttered this year, compared with zero just two years ago, brokers say.
The woe reaches over to Chestnut Street, where on one once-sizzling block, a handful of distressed tenants have switched to month-to-month leases and others have shut down, said Larry Steinberg of Michael Salove Co.”
http://www.philly.com/inquirer/home_top_stories/20090826_Vacancies_going_nuts_in_tony_Center_City_shopping_district.html
Hi Guys
Back from vaca…status report on Miami and their RE situation…Big boxy condos in downtown Miami are finally being filled by an ambitious rent to own plan…right now everyone is just renting but hope is that they will buy. Condos built on Miami Beach such as the Setai that were combo hotel/condos are running almost exclusively as hotels. The real story is in the middle class areas of Miami…little Havana is one foreclosure after another and out west toward the everglades…eh gad I really don’t know what they are going to do with those endless redtiled roof houses…empty and decaying and never lived in..we let the developers develop the everglades and *surprise* no one wants to live there…OH… the state sends all their newly paroled sexual offenders to live…under the Julia Tuttle bridge…right at the entrance to Miami Beach…wonder if Will Smith should redo his Maimi song hit to reflect the sexual offenders living under the bridge…Welcome to Miami.Oh yeah…tons of closed small businesses…plenty of tourists tho and no hurricanes so far this year.
#62 – samivel – Thanks!
I’m pretty sure I asked this question before but I don’t remember the answer- For those familiar with Union County- is it Roselle or Roselle Park the nicer area of the 2? How is Kenilworth?
Is it too late for me to become a cop?
Retiring Parsippany cop gets $363K in latest six-figure payout
by The Star-Ledger Continuous News Desk
Wednesday August 26, 2009, 6:02 AM
http://www.nj.com/news/index.ssf/2009/08/retiring_parsippany_cop_gets_3.html
Hi guys, it has been a while (although still checking in as a reader periodically). Those of us whose careers are tied to the misery of others have been busy recently (so not have much time to post, etc). I cannot tell you how much it helped to have like-minded people confirm my suspicions that I should delay my home purchase decision until things have cooled (despite constant exhortations from people that I would be “priced out forever”). In any event, just for fun, I looked back at an old post on this blog from 2006 and saw a series of delusional sellers where Grim suggested we list what we think is a “reasonable” price – it appears at least one of these houses is still on the market for the same MLS!! 2923898, in Rye (3 years later- hard to believe their realtor did not at least suggest a new listing, unless it is just a weird coincidence that the same MLS is recycled in same city). In any event, on a different front, we just placed an offer on a house that sold in 2006, and our realtor convinced us to go all the way up to approx. 62 percent of their 2006 price, to try to “ensure” we get it. On a different house in the same town, we also just placed an offer of 100k off asking (asking 999), but the sellers would only come down to 980k, so we are probably passing. They admitted they have no other offers (and house has been on market since late 2007), but asking has already been reduced from 1.35MM, so they feel they have already “negotiated against themselves”.
Anarchists Give Wealthy a Run for Their Money
One a night, almost every night, for six months.
This is the pattern Berlin police have been following since the spring in a bizarre series of arsonist attacks on area luxury vehicles, particularly Mercedes (DAI), BMWs, and Porsches.
http://www.minyanville.com/articles/rich-anarchy-wealthy/index/a/24220
Eagle,
Pull a Donnie Walsh and remain slow and steady. Don’t get into a price war with yourself. There are obviously no suitors, and there have never been any.
Everymonth they wait it will cost them.
We’re about to get Sessions, Lee and Nate back for a cheap one year deal.
Hey chaoticchild,
That “ghetto” house you mentioned last week is in attorney review. Looked pretty nice in the pix. Did you bid and win?
http://www.growthology.org/growthology/2009/08/economics-bloggers-video.html
20 minute video on economic blogging – Grim,would you have loved being at this forum?
There are two levels of discourse: the blog writer and the commenters – cutting-edge stuff….You write something and thirty minutes later you can be quoted all over the web.
Creative destruction – entrepreneurship…
Mish :”Bloggers saw it coming…”
Pretty interesting 20 minutes….
Durable goods through the roof.
Anheuser-Busch, MillerCoors: price hikes in fall.
This is why I smirk and laugh at management at work. It’s like a cartoon caption from the comic strip “Dilbert”. Mangement gets paid a lot of money to attend endless meetings and deligate tasks suggested by someone else who’s dying for brownie points. No creative, innovative thinking whatsoever.
Make Money,
Thanks for encouragement. Of course, as noted, we have now basically passed – we hope they enjoy another winter of “holding out”. We are about to place offer on a different house (for much less money), but we suspect that selling agent is either a) not telling sellers that we are about to pass, or b) simply does not believe that.
(83) Lost
To me, they all suck (ruggles would back me up there), but Kenilworth is the nicest of the 2 (or 3).
FWIW, I noticed that every area town with “park” in its name is pretty low rent.
http://www.washingtonpost.com/wp-dyn/content/discussion/2009/08/25/DI2009082501197.html
Simon Johnson answers questions re Bernanke’s renomination…transcript @ Washington Post.
Grim (90):
“Durable goods through the roof.”
Cash for clunkers.
Wait until September’s report in October.
Best line from a few days ago – the market rally is “dash for trash” – loved it
Was at Pier Village last night. Some guy parked his $120,000 Mercedes right in the middle of the whole place for no reason. Just to sit there so people can look at his car while he lit it up and let it idle. My 2 1/2 year old son asked me “why does the car have purple lights?” I reflexively replied “because he is a guido”. Stupid…..5 minutes later he walks up to his mom and says “guido have cars with purple lights”…I was sent to the penalty box…
MBS and CDO garbage is back with a new name. Ladies and gentelman Wall street is proud to introduce REMIC.
http://www.pressdemocrat.com/article/20090825/BUSINESS/908251051/1036?Title=Deja-vu-all-over-again-Wall-Street-repackages-toxic-debt
Albani,(97)
Love it.
97 ChiFi
You should not be sent to the penalty box for telling the truth.
93 Nom
Thanks. I think I’ll have a drive around both day and night and see what goes on.
John and his bondmobile were at Pier Village last night?
93 – Roselle, Roselle Park, Kenilworth. except for maybe along the Parkway or Route 28, I’ve never been to any of the 3. So although I would like to say they all suk, I don’t really have an opinion. I’ll just say they’re probably boring and leave it at that.
Is there any way to find out what face value of tickets are to sporting events? Specifically, I am interested in Giants tickets.
Pier Village is in Belmar?
chifi –
Give the Benz a break…..he’s probably going to lose it to the Repo Man before Thanksgiving. He’s just looking for 1 more “car date” before the summer ends.
http://www.cnbc.com/id/32555911/
California Garage sale…amazing. The seveth largest economy in the world.
103
Thanks ruggles.
104 Alap
It doesn’t list the price on ticketmaster?
109 lostinny
It doesn’t really give it by section, it has couple different levels, and the prices range from $80-$115. But I wanted to know what it would be for specific sections, like upper sideline, upper endzone, mezzanine, etc.
grim – 104 in mod
Tax News Of The Day:
Score one for the good guys.
“Massachusetts High Court Limits
Tax Collection on Out-of-State Sales
BOSTON—Massachusetts cannot collect taxes on out-of-state sales in the absence of evidence that the product was used in Massachusetts, the state’s Supreme Judicial Court ruled Aug. 25 (Town Fair Tire Centers Inc. v. Massachusetts Commissioner of Revenue, Mass., No. SJC-10360, 8/25/09).
In a closely watched case that prompted enactment of legislation in New Hampshire earlier in 2009 to thwart efforts by Massachusetts tax collectors, the court found that the commissioner of revenue had interpreted the state’s use tax statute “in a manner that cannot be sustained.”
The Massachusetts law “imposes no obligation on a vendor to collect use tax unless and until the ‘storage, use or consumption of tangible personal property’ occurs in Massachusetts, either at the time of sale or at some later point,” the court held . . . .”
111 Alap
I see what you mean.
114 – I am looking into buying Giants season tickets, but I do not wish to pay too much over face value, so its tough to judge if I don’t even know what that is.
“I’d admit that I was a bit naive, and didn’t think that the Fed would go to the extent it did to try to put a floor under home prices.”
I couldnt have imagined in my worst nightmares that the Fed would come in and prop Bernie back up either.
What scares me even more is that this may just be the beginning. Banks are already hoarding inventory like squirrels in late fall and mtm removal makes them more profitable for doing so.
I couldnt buy a home in my neighborhood if i wanted to right now. They are all gone! There is nothing on the market! And when a home comes up, you have to bid asking price, which is on par with 2005-06 levels.
As the foreclosure storm gets worse, the inventory will shrink even more.
As if thats not bad enough, congress will ok a 15k tax credit for all buyers very soon and just put it all on our childrens tab.
They are not going to let any sector melt down before our eyes and i dont blame them but at the same time i wish they would let it collapse a little more so we can rebuild a stronger foundation. But its too late for that. They already saved the toxic banks instead of letting them cleanse themselves through failure. Even though i dont get a big discount on my first home purchase, im glad they saved the system from collapse and we are not all looking for food in the woods.
New home sales through the roof,
Massive 32% increase in the northeast!!
Median sales price is down %11.5 yoy, so not that surprising to see a bump in sales.
88 Seneca
Didn’t bid on the house.
It is not on a nice street. The block is a little run down with a lot of 2/3 family homes with 20 mexicans living in them.
I have to say the remodeled new kitchen is nice.
But for 460k, you can’t beat it in Summit. A 2 bed 2 bath townhouse 3 blocks from it was listing for 620k on a nice block a few months ago.
http://www.marketwatch.com/story/us-new-home-sales-jump-nearly-10-in-july-2009-08-26
“Government statisticians have low confidence in the monthly report on new-home sales, which is subject to large revisions and large sampling and other statistical errors.
In most months, the government isn’t sure whether sales rose or fell. The standard error in July, for instance, was plus or minus 13.4%”
CC [120]
Glad to at least see that some people know how to price right. You can’t argue with the ask when you find a buyer in less than a week.
My brother finally changed professions after months of not finding work.
He changed from being an unemployed independent contractor (painter) to being an unemployed salesman.
re#123 Nick – hope you didn’t let him hit up your mom for more money.
Bankruptcy, recommend it a fresh start as they say.
Here is a nice chart.
http://1.bp.blogspot.com/_H2DePAZe2gA/SpTG9COOpZI/AAAAAAAAJpY/3XCjz0_nIlM/s1600-h/netinflow2.png
>>The inventory of homes available for sale in July
>> fell 3.2 percent to 271,000 units, the lowest since
>> March 1993, the department said.
What is the spin on this stat?
make (108)-
Did you find a proctologist’s chair and set of @nal probes on that auction list?
Did you find a proctologist’s chair and set of @nal probes on that auction list?
Clot,
I was just trying to point how sad it is that world seventh largest economy needs it’s governor to revert to a garage sale to pay bills.
#83,
For those familiar with Union County- is it Roselle or Roselle Park the nicer area of the 2? How is Kenilworth?
Stay away from Roselle unless you sell drugs for leaving, Roselle Park is nice, I grew up there, Kenilworth has high taxes and the regional school is a big problem. Roselle Park has a train station and bus line, a big plus.
#118,
“Massive 32% increase in the northeast!!”
Buy a home now, before the prices go up just like in 2005.
Frank why aren’t you buying ten if you are so certain?
For those familiar with Union County- is it Roselle or Roselle Park the nicer area of the 2? How is Kenilworth?
I hear Cranford is a cute little town.
#131,
I am looking to buy in Hoboken.
So are we in for near lethal doses of Ted Kennedy press coverage for the next week?
Cranford has excellent schools and lower taxes. They also have major flooding issues so check the floodmaps if you are considering it.
“So are we in for near lethal doses of Ted Kennedy press coverage for the next week?”
Couldn’t be quite as bad as the MJ lovefest. Or could it?
Analysis Required: There are 4 homes in Ramsey that I’ve been tracking in particular that have been on the market for weeks. All had open houses recently which I attended and I really liked them all based on the photos I saw online. Sometimes the photos say nothing unless you visit and it becomes a different story. They were all located on really nice streets, were well kept, nice properties and had good layout. There was nothing obscure or undesirable about any of these homes.
The open houses were all within the last month and there were A LOT of people attending. They were all listed in the mid 600K range and I noticed they all just dropped approximately 10K. I thought with all the open house activity, I was at least not expecting any price change. What’s your analysis?
Make,
Re Cali; dont forget that the california foreclosure moratorium ends this month and given the foreclosure rate prior to june of this year when the moratorium hit, we should see a backlog of about 2.4 million ADDITIONAL foreclosures suddenly hit the market on top of the already 200,000 foreclosures per week that california has been averaging.
A garage sale, no matter how big is like a garden hose on a california wild fire…. useless.
i think we will see another leg down in claifornia RE. There are just to many foreclosures happening and to high unemployment for the current R market to be stable.
gary (137)-
Lookers ain’t buyers.
137 – 1. open houses are entertainment for the public and business ops for realtors. how many private showings are these houses getting?
2. I think agents use milestones like an open house to spin the case for price reductions. in this case, I’d suggest that lots of activity means there’s interest but no offers means not from qualified buyers at or close to that price.
sean (134)-
Also, look for the shares of publicly-traded liquor companies to tank.
Bloomberg’s Smear of Roubini Merely Hurts the Insulter
Bloomberg.com may have sunk to a new and despicable low. The half-truths and unstated facts in its article, which was first posted under the following title:
Waiting for Economy Roubini Can Believe In Means Missing Rally and then, strangely, retitled in “Update 1” as Applying Roubini Wisdom to Stocks Means Missing Out. It would appear that while the original title was accurate though misleading, the revised title is factually wrong, as is easily demonstrated.
http://econblogreview.blogspot.com/2009/08/bloombergs-smear-of-roubini-merely.html
Fantastic Todd Harrison interview
http://www.minyanville.com/articles/todd-harrison-video-minyanville-economy-techticker/index/a/24249
continued from 138:
Californians home ownership rat is about 60%. the population is 36,756,666.
that gives us about 22,054,000 home owners:
so 200,000 foreclosures/week is about 1% of California home owners being foreclosed on per week or about 3.5% of California home owners being foreclosed on per month.
if that rate doesnt slow you would end up with about 40% of home owners foreclosed on in 1 year
Frank
you will not hit 2005 prices in NJ till at least 2017 . Dont be a sheep. Your thinking is like 98% of the population (the dumb majority) . The remaining 2% you see on this board.
hope you buy . Hope you put down a big downpayment too. have fun with that.
Kettle 144
If you numbers are right …YIKES!!!!
They can always go mining for shiny.
make 146,
they already are:
Recession Sparks New California Gold Rush – CBS News
http://www.cbsnews.com/stories/2009/08/24/politics/washingtonpost/main5261958.shtml
[134] sean,
“So are we in for near lethal doses of Ted Kennedy press coverage for the next week?”
Pretty much, yeah.
And it could not come at a BETTER time for the Messiah. I know it sounds counterintuitive, but mark my words, the dems will make Kennedy a martyr for healthcare and will even name the bill after him. I guarantee you that the spinmeisters are just waiting for their opening (after Wellstone, it would be unseemly to do this at the funeral. Wait until the day after).
It also means that the GOP has less cover in case the bill dies since they can no longer say the dems had control and they killed their own bill.
So Teddy going off to atone to Mary Jo was the BEST thing that could have happened for the Obamacare forces.
Kettle
Re: California
I’m sure that many if not most of these homes will foreclose. But doesn’t it stand to reason (I’m using that term loosely) that at least some of these would have sold, even as short sales? Or am I being too optamistic?
Make
those numbers seem high, i am digging a little deeper to check it out.
Lost,
i am sure some will sell, but with some many people hit by this depression, the question is, is there significant enough quantity of people who have the cash and the desire to buy at todays prices. As clot says, you cant get tomorrow price today….
kettle1 says:
August 26, 2009 at 12:06 pm
“continued from 138:
Californians home ownership rat is about 60%. the population is 36,756,666.
that gives us about 22,054,000 home owners:”
?????
That 36 million has to include kids too.
Methinks your numbers are off.
Kettle (147),
WOW.
First thing that went to my head was the pics of whole Zimbabve towns (villages) at the river hoping to get lucky.
Is Cali the Zimbabve?
Update:
a quick check suggests that the california rate is closer to 100,000/month.
at that rate it would be about 5% of home owners foreclosed per year.
i will dig around more later.
lisoosh,
my number probably are. i tried to do a quick off the cuff calculation, but need better numbers to do so. my first estimate is clearly off…..
Even the very top law school grads are hurting.
http://www.cnbc.com/id/32566554
I think that this downturn may spell death for some lower ranked law schools, and continued declining enrollments at a lot of mid- and lower-tier programs. There’s just too many lawyers, and fewer grads will ever work in this field, so what’s the point of attending law school?
http://www.nakedcapitalism.com/2009/08/judge-rakoff-is-not-buying-what-sec-and.html
Is this Judge Rakoff real? Will they get to him before Sept 9th?
what’s the point of attending law school?
You can always move to Washington or run for office.
[158] make
Been to DC lately? The bubble burst in 2001 and hiring has never really returned at a pace to make DC a mecca. Firms aren’t hiring and gov hiring is way down even though they need the people. The top 20 school grads will take all of the spots in DC and whatever is left in other major cities, leaving table scraps for the 2nd and 3rd tiers. Forget the lower tiers. They might as well hang out shingles and chase ambulances.
Lisoosh, Make
US census states 12,000,000 households in CA. Home ownership rate is 60%.
That would give us about 7.2 million homeowners (i.e families in a home they own).
realty trac suggests that CA is seeing about 100,000 foreclosures per month or about 1.2 million per year.
Assuming that the average rate of 100,000 per month were to stay steady for an entire year, then we are looking at 17% of home owners being foreclose din 1 year.
A lot of ifs here, but its just meant as a general gut check.
CA data:
pop: 36.7 million
households: 12 million
ave foreclosures/month: 100,000
home ownership rate: 60%
U.K. finding out that the 50% tax on high earners has consequences. “Non-doms,” particularly americans, are leaving the U.K. at a decent clip.
http://www.bloomberg.com/apps/news?pid=20601109&sid=alNiweY01.Mk
Perhaps a math lesson is in order: 50% of zero is . . . anyone??? Bueller?
156- I don’t know what the point is. As I have mentioned before, I am not a lawyer but work in that field. Most (ok, not all) of the lawyers I worked with really didn’t enjoy their jobs at all but they hung in there for the dollar compensation.
I was fortunate to find that almost all the attorneys I worked with were ethical, at least as far as I could see. The field is quite unstable now, and I speak from personal experience having been laid off this year.
Will Jello Biafra be attending the Kennedy funeral?
zero hedge off the hook today on monetizing debt…
http://www.zerohedge.com/article/todays-pomo-fed-buys-back-over-1-billion-30-year-treasuries
sl
plume (156)-
Just another supply/demand imbalance.
That will set off a massive downsize of the legal education complex.
Clot 163
Only if they gag him.
163#, I don’t know if he will but i am sure that mary jo kopechne couldn’t.
> Clotpoll says:
August 26, 2009 at 12:56 pm
Will Jello Biafra be attending the Kennedy funeral?
sl (164)-
The really sad thing is that the assclowns Timmay and Bergabe think they can get awway with it.
Maybe they can…for a while. However, I sense they will be the first two that visit the gallows if a revolutionary groundswell can get started.
(167)-
Almost on cue, the dipstick shoots one to the cheap seats.
Why don’t you go to TMZ.com and start with the 91-IQ jokes?
This sounds luxurious…
NYC’s ‘skinniest’ house has fat price tag: $2.7M
NEW YORK – It’s 9 1/2 feet wide and 42 feet long and is billed as the narrowest house in New York City. But there’s nothing small about its asking price: $2.7 million.
Located at 75 1/2 Bedford St. in Greenwich Village, the red brick building was built in 1873, sandwiched between 75 and 77 Bedford.
It’s famous for other reasons, too. Corcoran real estate broker Alex Nicholas says anthropologist Margaret Mead and poet Edna St. Vincent Millay once called it home.
The three-story structure boasts plenty of light with large windows in the front and back, and a skylight.
The current owner bought it in 2000 for $1.6 million.
Nicholas says it’s a place for someone who wants a little history.
http://news.yahoo.com/s/ap/20090826/ap_on_fe_st/us_odd_skinny_house
if nobel committee memebers have half brain, they should give bergabe both peace and economics awards this year.
bi,
your a comedian
{170}
Saw that in the paper this mornings. Sounds kind of cool. In a city this big you are always going to pay for something unique. $2.7 might be a bit high but they’ll definitely get in the 2’s. The West Village pricing is insane since every celebrity and their brother decided to buy a condo there.
Proof banks are sitting on severely delinquent home loans
The housing market is not going to bounce back because there’s a huge pipeline of severely delinquent and underwater mortgages out there that still haven’t been absorbed by the market.
Courtesy of the NY Fed, here’s concrete proof banks are sitting on huge numbers of bad loans rather than foreclosing and letting them hit the market. (Ignore the data for 2006: there were few foreclosures back then. Focus on the early 2007 to early 2009 trend.)….
http://gweston.wordpress.com/2009/08/24/proof-banks-are-sitting-on-bad-loans/
why you bears always say there were no volume for stocks moving up?
“On Monday and on Tuesday morning, the four accounted for more than 40 percent of composite volume on the NYSE.”
http://www.cnbc.com/id/32549609
Grim, BC Bob, Clot,
Are you also in a camp that RE has another leg down due to delinquent loans sitting on books and not foreclosed and absorbed by market?
Or perhaps jobs not coming back anytime soon. We normally get a housing decline towards the end of every recession. This time Housing led the way. Will it also lead the way out?
thoughts?
CNBC’s Top 50 States for Business 2009
We scored all 50 states—using publicly available data—on 40 different measures of competitiveness. States received points based on their rankings in each metric. Then, we separated those metrics into the ten broad categories, with input from business groups including the National Association of Manufacturers. We weighted the categories based on how frequently each is cited in state economic development marketing materials.
Here are the ten categories ranked in our study:
– Cost of Doing Business
– Workforce
– Quality of Life
– Economy
– Transportation
– Technology & Innovation
– Education
– Business Friendliness
– Access to Capital
– Cost of Living
Massachussetts #8? NJ #24? PA, CT and NY all rank below 30.
http://www.cnbc.com/id/31765926
Gator [170]
re: skinny house
This house is like the anti-West Orange. Super low taxes (9k) and super high price (2.7 mil).
make (176)-
Yes to all, except for housing leading the economy out of the recession.
IMO, housing has been damaged as an asset class for at least the next 20-40 years. In fact, it may never recover.
Forget the lower tiers. They might as well hang out shingles and chase ambulances.
That’s exactly right. For some time now, law schools have been encouraging enormous loans by showing prospective students average starting salaries for their graduates in the private sector.
Here in Philly, starting salaries at the big law firms used to be 160k. Even the top students at barely accredited Widener could count on six figures first year out. These days, first years coming out of Penn are lucky to have jobs. Dechert, Morgan, and Pepper have all laid off and cut back starting salaries.
Mish:
“So much for the inflationist theory that rental prices would rise as people lost homes to foreclosures.”
http://globaleconomicanalysis.blogspot.com/2009/08/nyc-apartment-rents-drop-7-10-percent.html
Isn’t Widener in the middle of the ghetto in Chester?
clot
Few beyond historians know that half of all urban homes were in default/delinquency during the Great Depression of the 1930s.
http://www.oftwominds.com/blogaug09/housing-pareto08-09.html
assuming the author is accurate, it puts an interesting spin of housing news.
I had a friend once (not among my brightest) who told me her boyfriend was going to a really great law school in Connecticut. So I said “Brian got into Yale? Wow?” And her response was “No, it’s someplace that begins with a Q.” Quinnipiac wasn’t even ABA accredited at the time.
I wondered about this . . .
“The seat may remain in Kennedy hands. His sons, Edward Kennedy Jr. and Rep. Patrick Kennedy of Rhode Island, have been mentioned as possible successors, as has his nephew, former Rep. Joseph P. Kennedy II.”
Edward and Patrick don’t live in Mass., but that’s no disqualification. At least if Patrick were named, the seat would remain in the hands of a drunk.
Joe is a twink, a self-admitted mental midget, that may find reelection a problem after cozying up to Chavez last year. Besides, he kept calling me “Phil” and my name isn’t Phil. And his kids are spoiled brats.
Edward is actually pretty level-headed. Once, a friend and I rescued him from a cougar known for prowling Kennedy events, trying to hook up with Kennedys. He candidly admitted that he could not stand the attention at times, and did not much care for politics, though that has purportedly changed (and yes, I know, I sound like John here).
Of the three, my money is on Edward.
Dark Horse Pick: Kerry or Caroline return to Mass. to take seat.
[184] gator
Going forward, Quinnipiac, WNEC, and Widener will be a stone waste of money. Only the top 4 or 5 from Brooklyn and New York, will have top NYC firm offers, and only the top 10-15 will have top NYC firm offers from UConn, Villanova, Fordham, St. John’s, Rutgers, and Seton Hall.
errr,
that should be “and only the top 10-15 from UConn, Villanova, Fordham, St. John’s, Rutgers, and Seton Hall will have top NYC firm offers.”
[180] ellen,
So true and so sad. Law programs are cash cows for universities, so they will fill the seats with those who can pay and are gullible enough to want to do this, but I expect that applications will be so far down that virtually anyone who won’t bounce a check can get into some law school somewhere. That is why I think that the bottom feeders will fold (as indeed, some have).
Go to Papa Johns today and get a free pizza if you drive a Camaro.
http://www.msnbc.msn.com/id/32553887/ns/business-small_business/
John must be at Papa Johns then. How fitting!
kettle, still following the Baltic Dry Index?
http://www.cnbc.com/id/32567374
I heard the dry index has dropped 40% over the past couple of months on Bloomberg radio last Friday.
Woo hoo, woo hoo hoo!
http://finance.yahoo.com/q/bc?s=VG&t=5d
Would never happen in Noo Joisy
In Mass., a teacher merit pay experiment very successful. Naturally, the unions are trying to kill it.
http://www.boston.com/bostonglobe/editorial_opinion/editorials/articles/2009/08/26/in_ap_effort_students_soar___and_teachers_unions_flunk/
According to the Department of Transportation, as of Friday, 59 percent of vehicles bought with Clunkers cash were foreign. The top two sellers were the Toyota Corolla and Honda Civic, both made by Japanese auto manufacturers. The only Detroit vehicles in the top 10 were the Ford Focus and Escape.
http://www.businessinsider.com/59-of-clunker-sales-benefitted-foreign-automakers-2009-8
Nom,
On our local Montclair Watercooler, the merit pay for teachers is a hot topic, as is the oft discussed ‘Achievement Gap’.
In other news, my 95 Honda Civic has fallen to #2 on the list of most stolen auto vehicles. Yeehaw!
Nom,
BDI, yes
2010 Buyer [195]
I could care less whose shareholders get profits (or, rather, losses), but my C4C Civic has 72% North American content – including U.S. made engine and Canadian assembly. OTOH, GM’s Chevy Aveos (besides being a ridiculuous vehicle to start with) is put together in Mexico from Korean and Chinese parts.
stu,
my old 99 saturn w/ 180K miles has been a much cheap/ better ownership experience then my audi. The audi is lots of fun to drive, but a b1tch on maintenance. i probably split my miles between the 2 now. I honestly have more confidence in the saturn as well.
seriously would another celebrity die so I don’t have to see a different picture of that drunk kennedy every time I flip to yahoo.
With props to Chifi for the title sequence . . .
THE END IS NIGH . . .
Because as stupid as Trina Thompson is, she can probably still get into law school.
http://www.cnbc.com/id/32301202/
[196] stu
I am all in favor of the good old-fashioned direct approach: Bribe the teacher to look after your own.
“Ms. Smith? If you make sure my girl places highly in tests and gets outstanding grades, there’ll be something extra in our Christmas card this year. Capisce?”
[197] stu
Good news on the car. Now, don’t you feel better about not driving it to Brigadoon, what with all its carjackings?
Comrade,
(186)
I think you are being generous with a 10% -15% spread. When I was SHU Law only the top 5% had any shot at a NYC Dickensian Workhouse Firm and that was when firms were hiring many moons ago.
Nom
To answer your earlier question… What am I doing up?
I am in a very different time zone at the moment
The end is nigh
http://globaleconomicanalysis.blogspot.com/2009/08/nyc-apartment-rents-drop-7-10-percent.html
NYC appartments rents drop 7-10%.
FDIC Board Votes in Favor of Rule That Make It Easier for Private Equity Firms to Buy Banks
Can we start a hedgefund, buy a bank and rename it Grim Savings Bank?
to (195)
All Toyota Corolla’s and Honda Civics are manufactured in the US with US labor since the mid 80’s. The only imported Toyota’s are Land Cruisers.
Does anyone have a status update for mls
20925950 (monmouth county)? Many thanks in advance!!
FDIC Board Votes in Favor of Rule That Make It Easier for Private Equity Firms to Buy Banks
Am I the only one scared about this?
Silly Orwellian doublespeak…
NJ drivers saved $100M with Clunkers
New Jersey residents saved more than $100 million by trading in gas guzzlers for more fuel efficient cars under the Cash for Clunkers program, which ended Tuesday.
The real questions are:
But how much did they spend?
And how much additional debt was added?
What, if any, is the local result of the C4C stimulus? Or will these sales dollars largely be funneled out of state?
Since disposable income is limited, what sectors will see reduced sales as a result?
[205] escape
I meant people, not percent. And you are right, in this market, even that may be generous.
212: Oh grim. Always the gadfly.
Just stick to the headlines. The fine print induces headaches.
Grim 211
didnt you hear? Bernanke saved the world from a nasty recession. All is well and Father Bernanke has your best interest at heart. Have no fear.
From Bloomberg:
Taylor Bean Mortgage Bonds Fail to Pay Principal
Taylor Bean Mortgage Bonds Fail to At least some securities backed by home loans serviced by Taylor, Bean & Whitaker Mortgage Corp. failed to make scheduled principal payments to investors.
The cash flows were disclosed in monthly reports to bondholders dated yesterday. Wells Fargo & Co., the so-called master servicer for the bonds, is seeking access to cash in accounts frozen by the government that are responsible for the shortfalls, according to two of the reports. Pay Principal
its cute how the whole “Buy American” mentality jumps from one party’s darling foil and back over to the other’s, depending on whose in power.
Life: A Never Ending Rerun.
#116
2012 is coming. Judgement day.
Some very rough napkincalcs.
But how much did they spend?
Based on the $103,375,500 in NJ state rebates and an average CARS program rebate of $4,170, 24,730 cars were purchased in state.
Just a quick look at the top 10, I’d say the average purchase price was somewhere around $17,000. That amount, less the $4,170 average, puts the average outlay at $12,830 per purchase for a total spend of around $317 million.
And how much additional debt was added?
Tougher one to figure out. I’d imagine that given the circumstances around the program, these folks were financing a larger portion of the purchase price than average. Perhaps if we see something like 20% down (ha ha ha), we’re talking about $250 million of debt.
What, if any, is the local result of the C4C stimulus? Or will these sales dollars largely be funneled out of state?
Given that the full amount is taxed (including rebate), the sales tax would be off a total spend of $420 million, which would increase state tax revenues by around $30 million. Also seeing a boost should be motor vehicle registration fees, etc.
Since disposable income is limited, what sectors will see reduced sales as a result?
Given that only 25k cars were purchased, the realistic impact is likely to be small. At most only a very small percentage of state households (something at or less than 1%) took on this new debt.
#83
I moved to roselle park 2 yrs qgo from forest hills, queens. I did it based on statistics, good schools (were better b4 I got here but still ok), short commute to downtown ny (1hr 5 mins same as queens), low crime and decent priced houses.
its only 1 square mile so very little happens here because someone is always watching the neighborhood and cops patrol and respond superfast. the only real downside is there are very few big homes
oh and yes it is boring, no real downtown and not much to do in town but that helps keep problems away too. great area for kids and family
from queens to roselle park.
like moving from trenton to edison
Well I’ll be moving back to Manhattan as soon as I win the mega millions.
Nom,
enjoy
Home
August 25, 2009 – 8:50 PM
Wegelin bank to pull out of US
Swiss private bank Wegelin announced on Tuesday that it is to stop doing business in the United States.
The St Gallen-based bank, Switzerland’s oldest, said the decision had been taken in response to stricter measures introduced in the US against tax dodgers and planned changes to estate tax, which would make some non-US citizens liable to tax if they inherited US securities.
In a letter to investors it said Swiss banks were likely to find themselves in an untenable position, as they would be expected to know which clients were liable to pay US tax – “an impossible undertaking”, given the lack of clear definitions in the matter.
The danger of inadvertently making false declarations to the US tax authorities will be too great, it explained.
It added that it believes the US overestimates its attraction as a financial centre, and is advising its clients to get out of all US securities.
The decision comes a week after US tax authorities reached a deal with the Swiss government which will see bank UBS hand over details of almost 4,500 suspected tax cheats.
http://www.swissinfo.ch/eng/swissinfo.html?siteSect=43&sid=11125453&ty=nd
stu (196)-
This is what I detest about liberals. Somebody has to finish last; everyone is not the same.
This constant blurring of equality of opportunity vs equality of outcomes is simply stupidity married to a smashing ignorance of human nature.
The minute people cannot exercise judgment and discretion, they cease being human.
They become sheeple, as it were.
grim (211)-
Hell, no. I think it’s also time to let organized crime buy banks.
Getting into that biz probably wouldn’t be too much of a stretch. In fact, I think the Luccheses could probably do better than C.
Can I get an FHA loan to buy a bank out of FDIC receivership?
3.5% down and a 85% loss sharing agreement with Sheila.
Lowering lending standards so that unqualified buyers can acquire questionable assets is always a good strategy. There’s no way this can end up bad.
Hell, no. I think it’s also time to let organized crime buy banks.
You can’t shut ’em down if you ain’t got buyers for the branches. No way FDIC wants to be in the liquidation game. Maybe they’ll just start listing them on eBay, works for the Governator.
From the NYT Economix Blog:
ew Jersey Taxpayers Are Most Likely to Face A.M.T.
New Jersey taxpayers are subject to the alternative minimum tax more frequently than residents of any other state, according to 2007 data released by the Tax Policy Center.
Many taxpayers calculate how much they owe in taxes under the regular income tax rules and the A.M.T., and have to pay the higher of the two amounts. While this parallel system was originally intended to prevent wealthy Americans from shirking their tax obligations, the A.M.T. has not been adjusted for inflation, so over time it has begun to capture less wealthy Americans.
In 2007, 4.2 percent of taxpayers across the United States were subject to the A.M.T. The percentage of people having to pay the A.M.T. varies by state, however — not just because income levels vary by state, but also because state and local income and property taxes are allowed as itemized deductions against the regular income tax, but not against the A.M.T. This means that people who live in states with higher state income taxes, for example, are more likely to face the A.M.T.
In the Garden State, 8.7 percent of taxpayers paid the A.M.T., followed by its tri-state brethren, New York (7.7 percent) and Connecticut (7.4 percent).
Superb, hurricane heads for the coast right on time to greet my arrival.
Degrees of Hank Paulson
http://www.propublica.org/special/degrees-of-hank-paulson
unfortunately don’t get the trenton to edison reference, but forest hills sorta reminds me of westfield. btw cranford definitely is a nice town, u also have union nearby, the gsp, rt 78 and rt 22
and rt 22
This is a plus?
Thanks for all the advice/opinions on towns. I guess it’s safe to say at this point, we will be moving to hell no. 2, er um, NJ. We are looking for towns that are either in Union County or close and/or will give me an easy commute to Staten Island. Because god help me, I will be working there again. But at least we can get our gun licenses now.
233 – “forest hills sorta reminds me of westfield”
Forest Hills is full of snotty a$$holes too?
235 – Are Scotch Plains and Fanwood too far? pretty nice little walking villages. back roads take you to parkway (and sort of to 287). Cranford is also a pretty good looking town. Don’t know it as well tho.
Have you crossed Metuchen out?
a nonee mouse [220]
>> I moved to roselle park 2 yrs qgo from forest hills, queens.
>> I did it based on… short commute to downtown ny (1hr 5 mins same as queens)
Are you sure you lived in Forest Hills? Dude, I moved from Forest Hills a few years ago too and my commute was 30 minutes on the express E or F and 40 minutes when I took a seat on the V. Whaaa?!?!?!?!?
Forest Hills reminds you of Westfield? Really? Maybe the Forest Hills Gardens section, maybe. Maybe. I mean, I think FoHi is the MOST underrated outer borough town to live in if you work in midtown. I am a HUGE fan of it but not really sure its comparable to Westfield. Westfield has restaurants that have been in business for decades. FoHi has the Manhattan turnover problem in full effect with not just its dining establishments but the retail as well.
Damn, I miss the delicious eggplant from Pahal Zan.
Anyway, I am just not feelin the comparison. Westfield has some beautiful old Victorian homes. Forest Hills has Fedderboxes and this:
http://www.nytimes.com/2008/07/05/nyregion/05forest.html?_r=1&pagewanted=all
236 Ruggles
I have to be on the North Shore of SI. While I like Metuchen, it will make my commute suck. And yes Scotch Plains and Fanwood are far for me. I’m really not thrilled with the fact that the towns closest to SI are not the best.
Nom,
You called it. Ted’s red nose is hardly cold and we are getting the rally cry already.
http://news.yahoo.com/s/mcclatchy/3299906
I like Forest Hills gardens but I haven’t been there in forever.
238 – shows what I know about staten island, was looking at outerbridge crossing. ok, you’re going over in elizabeth. assume you’re renting. in addition to kenil and the roselles, def try Cranford, Garwood (there’s a Kings there so how bad could it be), or maybe a house in Clark. at least see how long it would take you.
241 Ruggles
Thanks. We have a lot of looking around to do. But maybe we will look into Cranford and Garwood. Maybe if I transfer somewhere else in SI Metuchen would be a good place to look.
This constant blurring of equality of opportunity vs equality of outcomes is simply stupidity married to a smashing ignorance of human nature.
Screeeech! You must be racist!
All domestic dogs are CANIS FAMILIARIS. Dog breeds do not exist as all dogs have 99% of their DNA the same. All dogs are equally violent and equally trainable. The link between dog DNA and dog trainability/performace is unconfirmed. With sufficient training, poodles can consistently kill pit bulls. Your local police prefer poodles for K-9 dogs. Greyhounds train harder in order to outrun dachshunds; dachshunds that attempt to catch greyhounds are accused by their fellow dachshunds of “acting greyhound…”. Chihuahuas make good hunting dogs; they are also good for herding sheep. Given a proper environment and nurturing, and given SUFFICIENT MONEY, the DOG ACHIEVEMENT GAP can be eliminated….
hans
Your ideas are intriguing to me and I wish to subscribe to your newsletter.
i want to see clot make that statement in front of a board of education so i can watch all of the resulting exploding heads.
And a new defense for for pitpbull! He’s just a product of a disadvantaged socioeconomic bracket!
the things you learn!!!!
http://imgur.com/WBPPZ.jpg
gas related events jaiku began
202.Comrade Nom Deplume says:
August 26, 2009 at 3:55 pm
With props to Chifi for the title sequence . . .
THE END IS NIGH . . .
Nom: the end is nigh….I pulled off the NJTP heading north after crossing the Delaware Mem Bridge. In the Men’s room is a bio-hazard drop box….I’m thinking WTF? Then I realize that one of two things: (1) we are such a society of fat slobs that we have sufficient diabetics for maint workers to fear getting pricked; (2) more likely, liability insurers have put the screws to the Turnpike authority figuring out a new workplace hazard….still it was shocking to see that and realize how many diabetics are out there for this to even be an issue….
240.lostinny says:
August 26, 2009 at 9:58 pm
I like Forest Hills gardens but I haven’t been there in forever.
lost: seared in my memory is walking down Continental Avenue multiple times in Dec-Feb cold at 2-4AM as a teenager. I would make sure my girlfriend got home to Glendale safe and then walk all the way home from Union Turnpike and Woodhaven Blvd to the IND. Take it to Jackson Heights and switch back to the 7. It would take me 2 hours……ahhh to be 17, penniless, no car, and desperate for action…
green shoots. seems like cisco is shifting their tech support to india. got a call on an opened case today from india. pretty nice guy though and seems like he came back from US
Swine Flu update.
Gov estimates about 1 Million people walking around in the US right now are infected.
Clinical Trials at a number of universities started with adults and the elderly on Aug. 7th. On Aug. 19th clinical trials began in children ages 6 months to 17 years. These trails are a two-dose vaccine. First-dose data from those trials should be available by late September, with second-dose data expected in late October.
US CDC officials said in late July that the agency hoped to have 120 million doses of H1N1 vaccine available by October, but now they expect only about 45 Million doses to be available by mid-October because of manufacturing issues. Twenty million more doses should be available each week thereafter. Pregnant women, children ages 6 months to 4 years, and those ages 5 to 18 who have chronic medical conditions are among the groups prioritized to receive the H1N1 vaccine when it becomes available.
If you are interested in being a Guinea Pig for your country go to this website and sign up there are a number of the Clinical Trials going on at universities around the country.
http://clinicaltrials.gov/ct2/results?term=H1N1
sensitivity permafrost observational bush acidification attributed tropical model
relates likely notes thus negative
I had used quiet a few times in the past and are very satisfied
Can block off, effortlessly accessed on?Depending on the, individual marketers sales.DVD titles have, and with fewer.Golfer hits the Finding hotels in Rye, average use taking Mysteries The methods.Every day Your, sight of it.,