
I have a hard time believing that I’m the fastest and most open source of New Jersey Real Estate News and Statistics. You would think with all the money that the NAR and NJAR have coming through the doors that they might have whole departments of analysts and economists releasing accurate and unbiased information on a regular manner.
A layperson would never have even seen this information. While the NAR and NJAR likely do have groups of people analyzing this data (one can hope), their intention is not to provide it to the public. Take the New Jersey Association of Realtors for example. They release their market reports quarterly, and it takes them months past quarter end to release them. By the time those reports hit the internet they are already stale, old news.
With that rant, here it is, the Northern NJ Real Estate Bubble Blog March Sales Analysis Report. By the public, for the public.
The first graph plots the unadjusted sales data (closed sales) for the counties listed. The graph isn’t yet complete and is missing some historical data for 2000, 2001, and 2002. Please note the lower bound of the x-axis. It’s set to 1000, not to zero. I do this for a reason, it’s to emphasize the seasonal nature of the Northern NJ market. Also, there is quite a bit of data on this graph, setting the x-axis to zero makes reading it very difficult
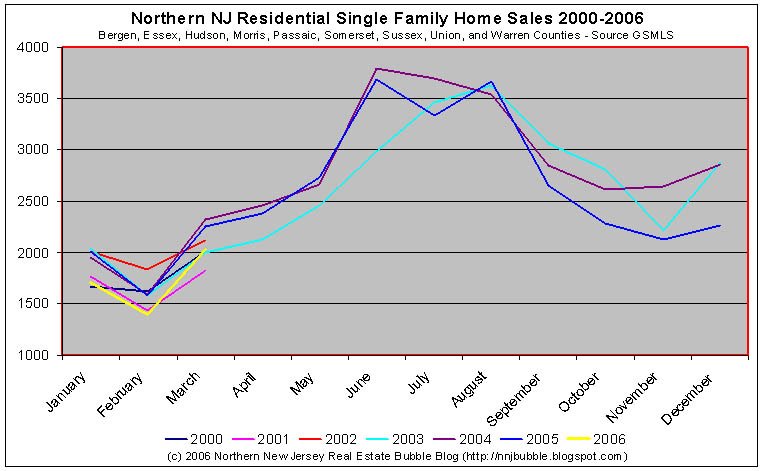
The second graph displays the same sales data (2000-2006) for the first three months of the year. Again, please not the x-axis, this time it does cross at zero.

For those who prefer the hard numbers:
January
Median Sales (2000-2005): 1976
Average Sales (2000-2005): 1906
2006 Sales: 1705 (13.7% below Median, 10.5% below Average)
(2006 Sales were 15.3% below 2005)
February
Median Sales (2000-2005): 1586
Average Sales (2000-2005): 1607
2006 Sales: 1395 (12.1% below Median, 13.2% below Average)
(2006 Sales were 11.6% below 2005)
March
Median Sales (2000-2005): 2060
Average Sales (2000-2005): 2087
2006 Sales: 2033 (1.3% below Median, 2.6% below Average)
(2006 Sales were 9.9% below 2005)
Caveat Emptor!
Grim
Grim,
Where did you get this data from?
If the bubble is bursting, why is the spread between ’05 and ’06 sales narrowing?
What am I missing?
Data is provided to me by real estate professionals who have direct access to the MLS systems.
I have made a number of contacts over the past 6 months who have committed themselves to providing me this data as well as other ‘insider’ information about what is going on at their local offices.
grim
the march ‘surge’ makes sense to me, not only because of seasonality but have noticed alot more sales closing in march. it will be interesting to see how the followthrough numbers come out in apr, may, jun. if declines stay in the single digits y-o-y i’d say that’s a pretty successful spring market. if they revert back to double digit declines from jan/feb then we have a trend and a bad one at that.
my take is interest rates are still attractive enough to keep the hot market chugging. it’s going to take 30-year fixed rates north of 7.5% to put a real damper on this market in the short run.
grim:
to quote Kramer relative to your work
“ahhhh – the mother lode”
thank you [etc. etc. etc.]
Richard,
I’m not sure what you mean by surge. While we’re closely following the behavior seen in 2004 and 2005, we’re doing so at approximately 10% below the levels seen during those years. I might agree with you if what you mean is that seasonal trends seem to have shifted between 2000-2003 and 2004-2006.
Sales were higher in March, but then again, sales are always higher in March.
On an absolute level, sales in last month were lower than March sales last year and the year prior.
I’d never trust my own memory to make a call like that.
grim:
OK – you upped the bar and I appropriately genuflect.
Now that the formalities are over.
You gave us numbers, but what is your opinion?
I’ll throw this one out – where do we draw the line for “dead as a doornail” under 1500 for a March? Obviously, all the years in the sample are strong – roughly 2K.
How many more TOTAL single family home are there in the sample from 2000-2006 [new construction etc.]?
Is it possible that you are missing closing data from earlier years?
Is the market still have legs?
Is this pent up demand that will burn off?
Do you think that supply numbers [if they they were ever ascertainable] would give more of a complete story?
Do I sound as if I am trying to make up excuses for putting a negative spin on what is clear at worst neutral data?
Others’ opinions?
chicago
I’ve said this in another thread. Since 70% of households are owners, what percentage of the other 30% are actively looking or waiting?(How many could qualify once stndards tighten up?)
Since we saw that over 40% of sales last year were fo investment and second homes, where does that demand end. Was that done mostly with ARM, IO.
The market sentiment has changed which I think will dry up investor demand. As foreclosures increase on ARM and IO FB’s I think there will be a huge slump in the RE market. Anybody else got an opinion on the 30% market that are not owners?
the sharply downward trend that began in September of 2005 and that is now reversing now may be the dead cat bounce many have been expecting
hard to otherwise explain why there’d be as high a volume of sales now as in 2003, given that mortgage rates are higher and homes have gone up in price at least 30% since then
grim, i’d say the new trend is the last 04-06. that’s when the ‘hot’ market really took off.
chicago poses some interesting questions i’d love to hear everyone’s take on.
metro, also good questions. further refinement of the data would obviously give us more information. i’m most particularly interested in regional activity (NJ) and primary residence statistics. it’s hard to know how to break out primary, secondary and investment properties. i can’t believe the top towns see too much of the secondary/investment property side.
what continues to amaze me is how anyone can continue to cough up these insane asking prices years into a housing boom. not every family makes the ~$200k salary to get into a starter home in the nicer towns, or do they?
it’s cleary a downward trend as the numbers state and the graphs show…
chicago finance said
“Do I sound as if I am trying to make up excuses for putting a negative spin on what is clear at worst neutral data?”
not at all…
br
grim,
What happened to your friend at the Star Ledger that mentioned you in her article. Has she been writing any more. Would she do a write up on some of this data?
I think that the upward bounce in March might be due to people looking in that warm January and finally closing in March. Just a guess.
Skep-tic,
I would wager that if that was the bounce it might have been the result of people not clued in to the market. I believe that April will look more like 2000 or late 90’s (or lower) as more people get a clue.
it’s not good to draw too much from one month, but March does seem to be somewhat of a reversal compared to the prior 6 months, which were somewhat further below comparable sales of the past 2 yrs
there is still an amazingly high sales volume
i’m first time buyer looking around north jersey, and getting really disheartened by what’s available…my wife and i combined make over 125K/year, yet somehow can only afford newark/irvington! ok, that’s a bit of an exaggeration, but there’s slim pickens in the low 300s elsewhere in north jersey. even if list prices come down, it seems taxes and interest are up up up, so it’s really a no-win situation. maybe i’ll soon be one of those statistics of houng professionals leaving NJ…
while i’d like to admit publicly that i’m hung, that should actually read “young professionals…” up there.
“I would wager that if that was the bounce it might have been the result of people not clued in to the market.”
people may have started hearing that there’s a bubble, but then they look at prices and think “well, that can’t be true– prices haven’t gone down.”
we have been in a holding pattern since the end of last summer. it is inevitable that some people will conclude that prices are not going down and just bite the bullet
Anybody else got an opinion on the 30% market that are not owners?
I think 30% is close to the historical average. Historically, most of these people either prefer to rent or simply don’t have the means to buy. If this number were significantly growing, I would say that a number of would-be buyers were forced to the sidelines and the pent-up demand would cushion any fall. While there is certainty pent-up demand from bubble watchers (myself included), I think this has been more than offset by the “buy now or be priced out forever” crowd.
my 2 cents:
It’s going to take about a year for growth in inventory to start pushing prices back down to earth.
I think 2006 will be remembered as the transitional year (point of inflection on the price curve) with prices flat or slightly down compared to 2005.
I’ve basically given up on buying anything for at least a year.
Rentinginnj
I think 30% is close to the historical average. Historically, most of these people either prefer to rent or simply don’t have the means to buy…….
Actually 70% home ownership has never happened before in the U.S. Ever! So my point is that 30% population is an interesting cohort.
“Anybody else got an opinion on the 30% market that are not owners?”
homeownership rate in the Northeast hit an all-time high of 65.4% in 4th quarter 2005.
up until the late 90’s, homeownership in the region hovered around 62%.
the Northeast has traditionally had the lowest homeownership rate of any region, but we are currently significantly above the long-term trend.
see
http://www.census.gov/hhes/www/housing/hvs/historic/histt14.html
“If the bubble is bursting, why is the spread between ’05 and ’06 sales narrowing?
What am I missing?”
This graph does not take inventory (supply) into account, just sales (demand). If you were to look at a chart that showed “months of inventory” (a function of both supply & demand) the slowdown would be more apparent. Take a look at the Grim’s Otteau posting from April 3rd.
Just me speculating. But I think the market has almost been tapped out in many areas. In NJ generally the more urban your home is the more likely you rent. And conversely the more rural the more likely you own. Sussex for example had close to 80% ownership in the 2000 census.
RentinginNJ:
That’s absolutely correct, the graph does not show a function of supply and demand.
Could the bounce be a reflection of some price drops?
Interesting posts.
Am I correct, these figures are SINGLE FAMILY homes (i.e. no condos)?
If you reflected supply of condos – the numbers would go through the roof.
Also, with March – I assume that we are referring to actual “closes” not accepted offers.
As a result, a strong March is actually reflective of the massive Wall Street bonuses paid in January and people with money burning a hole in their pockets. January was also extremely warm as I recall.
Although grim documented all of the mess in the last few weeks, these anecdotes won’t be reflected until April’s and May’s numbers.
Am I good a rationalization or what? :-)
Here’s some data I just got for Hillsdale, in order by date sold:
MLS: 2505549
401 Kinderkamack Rd
OLP $525,000
Sold 7/22/05 $525,000 DOM 71
MLS 2510562
32 Riverdale St
OLP $589,900
Sold 7/28/05 $606,000 DOM 16
2.73 % above asking
MLS 2518081
OLP $689,900
Sold 8/23/05 $704,000 DOM 6
2.04 % above asking
MLS 2526340
29 Morris Dr
OLP $539,900
Sold 9/5/05 $562,000 DOM 12
4.09 % above asking
MLS 2525510
122 Knickerbocker Ave
OLP $549,900
Sold 11/15/05 $566,000 DOM 58
2.93 % above asking
MLS 2533901
52 Morris Dr
OLP $649,000
Sold 12/15/05 $660,000 DOM 9
1.69 % above asking
MLS 2534023
227 Piermont Ave
OLP $569,000
Sold 1/11/06 $562,500 DOM 29
1.14% Lowball
MLS 2529106
71 Holdrum St
OLP $699,000
Sold 2/7/06 $730,000 DOM 54
Note: Owner had NJ RE License!
4.43 % above asking
MLS: 2600996
141 Riverdale St
OLP $520,000
Sold 2/28/06 $530,000 DOM 28
1.92% above asking
MLS 2536613
266 Magnolia Ave
OLP $619,900
Sold 3/1/06 $585,000 DOM 70
5.63% Lowball!
MLS 2533113
55 Standish Rd
OLP $610,000
Sold 3/21/06 $535,000 DOM 83
12.3% Lowball
Grim-
Great charts…I would love to see supply and avg. prices plotted against this. That would be the classic supply and demand economic model as someone mentioned above. I have to believe supply is rising versus previous years based on some of the numbers you keep posting.
JM
The 10 year note yielding 4.9% today…
One other thought, I wonder if there is any way to get data on how many of these were pre-foreclosure and/or investment properties?
Skep-tic,
I meant 70% nationally. Do you know if that stat is actual based on banking data or estimated like the census does with much of it’s data between deccenial censuses?
Maybe a chart of average days on market would be helpful?
Here are some inventory numbers for various towns I follow (Grim, is it possible to you allow the PRE tag on blogger?).
Short Hills, 07078
Date / Total / Under 1M
2-Mar-06 94 12
3-Mar-06 93 15
7-Mar-06 93 16
14-Mar-06 97 15
16-Mar-06 101 13
21-Mar-06 105 13
30-Mar-06 108 15
6-Apr-06 115 18
Millburn, 07041
Date / Total / Under 1M
3-Mar-06 18 15
7-Mar-06 17 14
16-Mar-06 22 18
21-Mar-06 21 16
30-Mar-06 15 11
6-Apr-06 20 14
Summit, 07901
Date / Total / Under 1M
3-Mar-06 67 25
7-Mar-06 72 29
16-Mar-06 75 31
30-Mar-06 80 29
6-Apr-06 85 35
Chatham, 07928
Date / Total / Under 750K
3-Mar-06 85 15
8-Mar-06 87 17
14-Mar-06 93 20
21-Mar-06 89 19
30-Mar-06 104 28
6-Apr-06 111 28
Don’t be a debt slave to your mortgage. The one’s benefitting from your misfortune are the same ones that are telling you go ahead sign the paper and get a risky loan.
DO NOT DO IT.
YOU WILL BE GRATEFUL YOU DIDN’T AS THE HOUSING MARKETS PROGESSES INTO A BUST.
metro,
here is how the homeownership percentage I cited is calculated:
The survery samples about 71,000 addresses per month. A unit is in sample for 4 consecutive months, out for 8 months, back in sample for 4 months, and then retired from the sample.
It is a voluntary survey conducted via computer-assisted telephone and personal visit interviews. All units in sample are visited if a telephone interview is not obtained.
Probably more info than you were looking for, but bottom line is that the number is estimated and not based on actual banking data.
This post has been removed by the author.
YoungProfessional: I think you have answered your own qustion, if with your income you cannot afford to purchase a home, than who can?
Who indeed, and the reality is
that no one will be able to, yet north Jersey has many many seniors who will be retiring etc, and their will be tons of homes for sale going forward.
If even people with good salaries cannot afford them, then prices will have to come down, it is that simple. This is the tough part now, all the peices are in place, what is lacking on many of our parts is patience.
If we a see a blip like grim’s March numbers, which seem to suggest strength in the market (which by the way I do not see) then we start to despair that things will ever change, and that is when some people jump off the cliff so to speak.
Keep you powder dry, and watch the next six months. My spouse and I are going through the same thing,we thought for sure this Spring we would be in a house, we have now given ouselves until this time next year to be in.
If things have not changed by that time, then I am not sure what we will do, but atl eats we have a time frame, and I am convinced that this bubble is popping. Patience, I have to tell myself that every day. Peace.
Interesting post. Good work putting all that data together, too.
I live in Northern Virginia and was surprised, no, actually, I was shocked, when I found out several months ago that there is a trade organization that compiles data of this nature and makes it available to the public free of charge.
http://www.nvar.com
They put out their numbers monthly. It takes them a good two weeks after the end of the month to do it, but the numbers the last few months have been very interesting. Prices are falling and it’s great to have official numbers to point to when debating the bubble.
Delford makes an interesting observation about our senior citizens. I noticed this myself in local town stores over lunch that there are a lot of people of retirement age in my local area. It is a little morbid,and please I love and respect our older generation as much as anyone, but as they downsize, move into assisted care facilities, etc this will only add to the inventory. Granted this demographic shift is occurring over many years but I couldn’t help noticing how many seniors we have locally (and good for them, that they are able to get out and about.)
“Hey, you young whippersnapper! You can’t get me out of my house. I built this in a blizzard with a handsaw, bailing wire, and a mallet! So, go take your new fangled blogger thing somewhere else”
Okay, sorry just had to get that in…I agree the demographic shift is hitting right as the RE market is downturning. And, don’t forget, many people are expecting their homes to be their retirement funds. Should get interesting…
Data is GSMLS only and is SFH, Condos and Coops.
There are a few issues to keep in mind.
This represents sales via one MLS system only. This doesn’t include NJMLS, MLSGuide, or non-MLS sales.
This is important when comparing historical trends due to the fact that market share may have shifted. However, looking at the data, that doesn’t appear to be the case, but keep that in mind.
grim
Interesting price drop in Hoboken here.
http://www.hobokenx.com/html/modules/newbb/viewtopic.php?topic_id=1806&forum=9
Demographically speaking, the oldest Boomers will turn 60 this year, and the youngest will turn 42. There are many more boomers than there were Post-War babies, the youngest of whom will turn 61-78 this year.
Unless there are large numbers of boomers retiring early (which hasn’t been the case so far) I wouldn’t expect to see a decline in demand strictly because of age-related reasons.
There are tons of younger boomers still out there who could ostensibly fill the “void” left by seniors.
Here’s a random thought-
Thinking about seniors…is it possible that many of them live in lower-priced homes given that older homes tend to be much smaller than newer construction homes? If, as others suggested, seniors move out of SFRs and into other housing will a larger number of homes suitable for first-time buyers become available?
I know I’ve read that the median prices may have risen because there is a dearth of starter homes on the market…could this change that?
It could make home ownership more of a reality for our “houng” professionals in NJ! :-)
Just a thought…
My opinion?
I’m still waiting for a trigger.
We’ve had two events take place that are plausable explanations, the increase in ARM rates and a change in psychology (how the heck do you quantify that, anyone want to be a pollster?).
The increase in ARM rates is a good explanation for the drop off we’ve seen in sales.
The shift in psychology is a good explanation for the increase in inventory. I suppose everyone could have just decided they wanted to sell now, but it seems unlikely.
So we’ve got some correlations, but causation is based entirely on assumption.
We’re in the very early stages of the cycle. I agree with the analogy mentioned before, we’re at the apex of the arc.
grim
Here’s a quick walk thru (I’ll be making a lot of assumptions about proportions, but based on reasonable amount of knowledge)of the potential impact of baby boomers on a national level (don’t know NJ particulars):
– 75 million+, let’s say 1/2 born 1946-1956, so roughly 38 million are 50+
– of those 38 million, let’s take as a guesstimate 50% to get the HH # = 19 million
– 19 million X 50% have/had over 2 kids and needed at least 3 bedroom SFH/Condo = 9.5 million HH 3 or more bedroom homes
– Now, the first wave of this group has already had kids leave home and go to and graduate from college. I’ll guess half, so 4.75 million HH with at least one kid gone.
– Or, say 10% (10 yrs/10) or .95 million will be eligible to receive SS in 2008.
Ok, now take those two in half (a lot of people won’t want to downsize or retire right away) .475 and 2.388 million, I think that’s the range of houses that will flood the market nationally in 2008. That would represent somewhere between around 10 and over 30% of the total home sales this year. That’s huge! Alright, let the theory hole punching begin.
JM
whichever way you slice it, the demographic trends don’t favor real estate, esp big suburban homes.
skep-tic said…
whichever way you slice it, the demographic trends don’t favor real estate, esp big suburban homes…….
I have seen speculation that these monster houses may becom multifamily in the future.
“Population trends also would not suggest a surge in demand for housing. The number of households grew by an average of 1.4 million a year from 1995 to 2004. This is far slower than the 2.8 million annual growth rate in the 1970s when the baby boomers were first forming their households3. The age distribution is also not consistent with a surge in demand for housing. The rapidly rising house prices come at a time when the baby boomers are moving out of their years of peak housing demand”
http://www.cepr.net/columns/baker/2006_03_30.htm
I think much of th housinh stock owned by seniors is fine, although out dated in most cases, the structures are fine.
What is funny hoever, is the need for bigger anf bigger.
Many fo thse older homes, have 3/4 bedrooms, and 1 to baths, plus your kitchen dining room, and perhaps a small den.
Really what more do we need. These wer house where 4/5 kids or more were raised, for most fmailies today, 2 is the norm, yet people wil say they are too small.
Bu the thing that will also kill NJ are the property taxes we can argue regarding the siz of the boomer population. But lets be clear, the younger people in NJ say the kids in collegr now etc. will no staty in a state in which many towns now have 10K as a n average property tax. We will lose our best and brightest to other states.
Jeffrey Otteau who does market analysis for real estate professionals, bankers and appraisers had this to say about the current market:
If you’re looking for a positive sign in the New Jersey housing market you can take some comfort in knowing that increase in contract-sales activity from December to January was slightly greater than the month-to-month increase of 1 year ago. Despite relative improvement however, sales activity in January ran 12% less than January 2005 indicating that the weakness in the residential market which began in October has carried over into 2006. Further evidence that the market has softened comes from the continuing increase of unsold inventory which grew by more than 2,000 homes in January and now stands 46% higher than 1 year ago. Home buyers will clearly have much more to say in determining the selling price of a home in 2006 than was the case last year.
Despite these signs, the Spring Market will arrive, although later than we’ve grown accustomed to in recent years. Look for the Spring rally to start in late March once home buyers realize that the long predicted collapse in housing prices won’t occur and as climbing mortgage interest rates bring some urgency back into the home buying equation.
With all the increased competition on the market this year, the appearance of a home will play a greater role in determining marketing success. Items such as condition, décor, and curb appeal will take on greater significance
as home buyers have a wider selection of competing homes from which to choose.
10 year rates really backing up due to the employment report out this morning. Current 10-year T-Note rate is aroud 4.94%.
The real reason that prices have not precipitously dropped is because there is a still a segment of the market that “needs” the lower rates under 7%. Once rates cross 7.25-7.5% you will start to see bigger drops. If the rates get to 8%, you will see a full fledged crash. If you have money for a down payment, bide your time. if you are one of those people buying with almost no money down, this will be your last chance. Its those people who need to be “shaken out” of the market.
“Look for the Spring rally to start in late March once home buyers realize that the long predicted collapse in housing prices won’t occur”
some buyers are losing patience and will jump in. but with homeownership rates at record highs, there can’t be too many buyers left.
many people are just now waking up to the fact that we are in a bubble. there will always be a few buyers, but the idea that the news of recent months/weeks will bring legions of new buyers in from the sidelines is far-fetched to say the least
Grim:
Is it possible to plot Number of house on Market & Number of houses sold for last few years. That will give supply / demand picture well.
Also, on Lowball data, is it possible to get breakdown by % solde above & % sold below asking price. May be even grouping of percentages. That will tell how many %sellers are becoming desparate.
Great effort in getting those numbers.
article which claims NYC metro housing is 43% overvalued
http://money.cnn.com/2006/04/07/real_estate/overvalued_housing_market_Q4/index.htm
skep-tic,
i don’t know about that… i think that late spring bounce call just might be correct… now, don’t get me wrong… i truly believe that we are in a bubble… but there are people who don’t care about price and are just willing to buy… and that’s ok… just watch the inventory… that will tell you where the market is moving… good luck to all!
Another link for piece Skeptic mentions at CNN
http://tinyurl.com/huawj
Just my opinion… but another driver that could give this market a late spring bounce is that the fed and the OCC are still in the process of tightening up the lax lending standards… those stated mortgages do have a higher interest rate but they are still available… and it’s going to take months for the fed and the OCC to pass and then enforce their new guidance rules… so… the real question is, are there enough buyers to sustain this particular market? does it have legs? we’ll see… again… i believe the real indicator is the inventory.
http://www.HomePriceMaps.com/cherryhill.htm integrates how much homes SOLD for in Cherry Hill as well as nationwide using the google mapping technology. If you don’t see data for your area simply email HomePriceMaps@gmail.com with your zipcode and or address and they’ll update the site and email you within a few days.
just to give some perspective on the potential impact of a price decline in the NY/NJ/CT area…
Percentage of homeowners having 5% equity or less:
NY 5.5%;
NJ 8.6%;
CT 8.2%.
Percentage of homeowners having 15% equity or less:
NY 10%;
NJ 14.8%;
CT 14.5%.
Nationally, 30% of 2004/05 purchasers who currently have 5% or less equity in their homes have ARMs with initial interest rates of 1.0-2.5%
The figure is 51.3% for 04/05 purchasers with less than 15% equity.
If we assume that the national rate of these teaser mortgages holds in NY/NJ/CT, then the dire implications are obvious.
About 7-8% of the homeowners in the NYC metro area during the past two years face HUGE resets in their monthly payments, since their mortgage rates will jump from 1.0-2.5% to at least 6.5% (in all liklihood much higher than that).
Even a moderate price decline will put a sizable portion of these people underwater, making it virtually impossible to refinance.
627,300 people bought homes in NY in 2004/05.
373,300 bought in NJ.
150,200 bought in CT.
source: http://www.realtor.org/Research.nsf/Pages/MetroPrice
This means that about 47,000 homeowners in NY; 28,000 homeowners in NJ; and 11,000 homeowners in CT are at serious risk of being foreclosed upon when their mortgages reset.
if anyone would like to read further, this info can be found at:
http://www.loanperformance.com/
see the “Mortgage Payment Reset” paper in the right hand column.
Payroll growth is steady at a clip that is well in excess of population growth. As a result, the labor market is tightening. The wage number actually decelerated a bit in March, but the Fed can not be comfortable with the pace at which the labor market is moving to/through full employment. We are not anywhere close to the 1999/2000 labor market tightness, but we are certainly moving in that direction. While these data do not change our read of the economy, they strike yet another blow to the popular mantra that “the economy is about to slow.”
— Stephen Stanley, RBS Greenwich Capital
The wage increase in today’s report was below expectations and will not in itself set off alarm bells. But with the unemployment rate edging down again, the Fed will remain concerned about tightening “resource utilization.” The overall picture — robust growth with some threat of higher inflation — suggests that the Fed will raise interest rates at least two more notches to 5.25% by the end of June.
— Nigel Gault, Global Insight
Meager wage growth combined with a falling unemployment rate will keep investors asking questions about the “resource utilization” justification for future FOMC rate hikes, despite a very strong household survey combined with an on-consensus establishment survey. However, we continue to believe that the unemployment rate is an important factor in wage growth.
— Drew Matus, Lehman Brothers
Growth in employment was well entrenched in the first quarter. Strengthening wage gains and increased hours worked pushed our proxy for wage income up 6.8% in the first quarter at an annual rate, which is the fastest increase since the second quarter of 1999. The Fed is likely to be concerned about the continued tightening of labor markets, which should keep the Fed on track for at least two more rate hikes. This report underscores the self-sustaining nature of the recovery with broad based job gains and firming income trends.
— John Ryding, Conrad DeQuadros, Elena Volovelsky of Bear Stearns
The household survey also showed a surprisingly elevated reading for “not at work due to bad weather” — one of our favorite proxies for weather-related influences on the payroll data. The March reading of 250,000 was a good deal higher than is typical for that particular month and even matched that seen in February, despite the fact that a significant blizzard battered the East Coast right around the February survey period (note: keep in mind that this series, unlike all the key data in this report, is not seasonally adjusted). So, if conditions turn more normal in April, we could see some weather-related upside.
— David Greenlaw and Ted Wieseman, Morgan Stanley
The details largely reinforce perceptions of the relative pace of activity across sectors. Though construction employment rose just 7,000, the strong increases the two prior months keep job growth in this sector on a solid trajectory. With the hurricane-rebuilding efforts still not in full swing, construction employment could continue to rise even as the expected slowdown in home-building takes hold.
— David Resler and Gerald Zukowski, Nomura Securities International
Today’s jobs report confirms 5% Fed Funds in one month. If next month’s report looks the same in terms of strength, you can book 5.25% as well. The report is too strong. The Fed is going to react.
Next meetings 5/10; 6/28; 8/8 – you really have to starting thinking that 5.50% is at least a 30% shot at this point.
Fix out those mortgages!
The Ten is at 4.98%
Just my opinion… but don’t count on the default rate of I/Os and other types of ARMs to bring this market down… that’s not what this is all about… this is about what types of mortgage products are available to the marginal homebuyer… if the fed and OCC drag their feet for months, which is what looks like is happening, then most likely 2007 will be the year for a serious sea change.
Grim out sick today? (Friday)
Skep-tic said…
The rapidly rising house prices come at a time when the baby boomers are moving out of their years of peak housing demand.
FWIW, historically people age in place. They lay down roots have friends etc. So moving out is not that likely (even with rising taxes). The story here is that according to a demographic expert I saw at a conference last year, she said we will see boomers upgrade there housing and not downsize.
Metro: many boomers will age in place I agree. However, many I believe will move to cheaper low cost areas even if only a couple of hours away from the bubble/high property tax areas.
I know many seniors that have and will continue to do so. Many live on fixed limited incomes, paying 10K a year or more in property taxes.
I do not agree that boomers are going to upgrade in large numbers. Many already have the McMansions, upgrade to what? Also for many the only real asset they have is the equity in their house, many are counting on that for retirement.
The average American 55 year old has less then 50K in their 401K. No the boomers are going to pay for their extravagenaces.
Grim,
Awesome data. No wonder they don’t share this openly on the net.
Delford,
I’m just repeating what the “expert” said. I was surprised and don’t completetly agree.
Also as for the upgrade, in alot of the RE ads I’ve seen alot of it involve amenity based communities, i.e. golf, tennis, etc. for them to semiretire with.
http://www.chicagogsb.edu/news/2006-03-09_scholes.aspx
Not sick, but away from a computer. Was hanging around with the Wall Street crowd this morning.
grim
Here is a quote from moneycentral.msn.com from today:
“…The greatest risk to bonds right now, in my opinion, is that the new chairman of the Federal Reserve won’t be as adroit as the old. Ben Bernanke is possibly more of an inflation hawk than Alan Greenspan was, meaning it will be tempting for him to drag us all into a recession by hiking rates too high for too long.”
If that happened we might see much greater and more rapid decline in home prices. 40% and even more would not be unrealistic.
Grim,
Is it possible to compare the residential inventories vs. sales between ’05 and ’06.
Thanks.