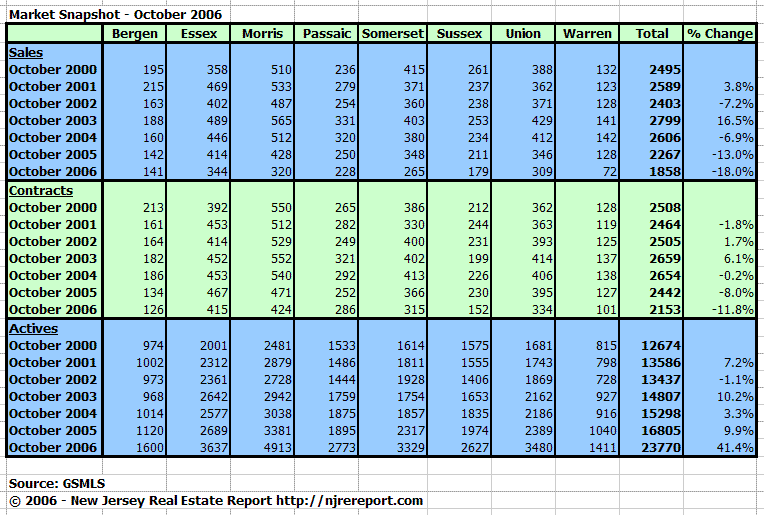
The key numbers from this dataset are the contracts numbers. Contracts are a forward looking indicator of sales. Contracts signed today typically close within 1-3 months.
October 2006 contracts are running approximately 11.8% below October 2005 contracts. We will likely see a future sales volume continue to decline from 2005 levels.
I’m not sure how anyone can call a bottom to this market yet. That is nothing but pure speculation… or wishful thinking…
Interesting CNN report on homebuilders convention. They are finally seeing how bleak everything is. Hovnanian and Robert Toll have a bit of a squabble too.
Grim — ditto Mike R.’s question. So many contracts are falling through these days that they seem to be a totally unreliable indicator of the real market. How many actual closings are there, month-to-month?
Grim,
This is definitely helpful. I think this is a combination of three graphs that you ususally put out every month, namely: (1) monthly sales data which you just put out several dates ago, (2) activity, which can be generally/indirectly represented by the GMLS inventory number, and (3) most importantly, the contract, which give us a sense what the future sales data would be.
Thanks,
007
i know this is a bit of generalization, but it seems most of decline is coming from decreased sales and contracts in morris, somerset, sussex and warren counties (actually about 75% of the decline). doesn’t this seem to indicate that the bursting bubble, per se, is affecting the counties further away from NYC (as would make sense). Essentially, passaic, bergen and essex counties seem to be doing somewhat okay, although lagging as well.
I’m not sure I’d make that same assumption based solely on this dataset. The monthly numbers can vary dramatically by county, simply due to the small sample size.
Great data. I don’t care what Clot or any RE “expert” wants to say on this board. These are “the new reality” numbers.
JB, I’m not sure who, but someone keeps posting Bergen numbers from the mid-90’s and I find those as fascinating as well. Again, a small data set, but a view back into reality before the craziness.
Don’t know where this will lead us, but not good for builders, RE agents, or mortgage companies.
I know this is the housing market and not the stock market, but as any trader would know, volume precedes price. So this decline in sales volume is foretelling future price declines.
doesn’t this seem to indicate that the bursting bubble, per se, is affecting the counties further away from NYC
Itulip.com ran an article about the geographic anatomy of a housing bubble burst. They argue that the bubble begins in the cities and then expands into the suburbs and out into rural areas. The collapse then happens in reverse order. These data, if statistically significant, would seem to support this view.
The itulip article sounds logical, but not sure if it absolutely works in today’s market. Assuming Manhattan is the metro and everything else in 10 miles (Hoboken, Queens, Brooklyn, etc) are at the border… at least what I have observed is a downward trend that is more significant in Manhattan (I am just looking at 2BR condo apartments) then Hoboken or Brooklyn.
HSD-
It seems like pockets radiating out from NYC to me. Like certain neighborhoods that were “iffy” before the bubble and experienced a lift are now starting to feel the contraction. I don’t know if it’s perfect concentric circles like itulip uses. More like overlapping smaller circles, little circles within rings, etc.
I think RentininNJ is on to something though. If itulip is right, then Bergen, Essex and Pasaic should start to really decline in the spring.
“know this is the housing market and not the stock market, but as any trader would know, volume precedes price. So this decline in sales volume is foretelling future price declines.”
This is what I learned in my economic class as well. i.e. price is a factor of supply and demand. Not according to NAR, who claim supply can increase, sales can slow drastically but prices will keep going up indefinitely. Remember: “This time it is different !!”
An interesting quote about Inflation from this weeks Barrons journal.
“As to Inflation, computers, as the economists never tire of telling us, undeniably are cheaper than ever. The question is though: Have you ever tried eating a computer? Or living in a house made of computers? Or driving a computer to work? For, by contrast, the cost of shelter and food and fuel and lots of other stuff that is still quaintly considered by most of the citizenry as essential ingredients off the good life are awfully pricey and getting pricier
Nor should we forget, in taking the measure of the economy, that it rests on a very but tentative foundation, indeed: a giant but rapidly deflating housing bubble floating on a vast sea of debt”
That’s an interesting theory regarding the reverse cascade of prices from outside to the large cites. That may help explain why we’ve been seeing huge drops in Morris but not in high end Essex or other towns closer to the city.
rentininnj…thanks for the link to itulip..interesting article.
my only concern would be what we take to be the metro area. on most other place in the US it’s pretty clear. but in ny, employment is so diverse (from manhattan to bklyn to jersey city to parsippany to white plains, etc.) that there might be mini-metro areas where this article makes sense too.
Don’t worry about my office. We shed our low performers back in March/April. When I start hearing excuses & all the usual lame BS, it’s out the door for you! I knew one of my competitors was recruiting these losers, and I didn’t even care. They all went to this guy, one by one, and now he’s choking on their lack of production.
We fielded a call from Barnes & Noble last Friday…a past employment verification on one of those agents. Looks like she’s gonna be moving into one of those fast-track clerk positions.
I’m really enjoying this. Our base crew here now averages 15+ years in the biz, so we’ll be there at the end of the carnage…but it’s oh, so fun to see the marginal, “quick buck” artists drop like flies. Serves ’em right. As always, I’m the first to agree with most here that if our practitioners charge a surgeon-like fee, we should deliver that kind of result.
check out this ad from fairfield county craigslist… this guy should be thrown in jail immediately, and then given remedial english lessons…
*************
Paying rent every month and realized that you have the same amount of money saved? Do you want to save more money?
The richest people in america makes money from real estate. Doesn’t that tell us something?
I can get you into a home with no money down and closing cost in the loan. Houses appreciate every day so even if your going to take 30 yrs to pay off your loan the value of the house will go up at least 20-30% in the next 10 yrs.
NO Green card work permit?? Now OK
late on this one from europe. interesting article/link concerning the trends in and out of the city. if you combine this analysis with BBC’s popluation growth thru 2015 (see URL below) you might have a sense that the drops and growth will be more highly correlated in the future, as more and more of us live in, or border with, major cities.
great interactive map (SAS will love the asia forecasts)….

The key numbers from this dataset are the contracts numbers. Contracts are a forward looking indicator of sales. Contracts signed today typically close within 1-3 months.
October 2006 contracts are running approximately 11.8% below October 2005 contracts. We will likely see a future sales volume continue to decline from 2005 levels.
I’m not sure how anyone can call a bottom to this market yet. That is nothing but pure speculation… or wishful thinking…
jb
Interesting CNN report on homebuilders convention. They are finally seeing how bleak everything is. Hovnanian and Robert Toll have a bit of a squabble too.
http://www.paperdinero.com/BNN.aspx?id=50
60% increase in actives, BC, as compared to 10/04!!!
Clot,
Almost 100% increase in actives, from 10/04, in Somerset!!! WOW!!! Start cracking the whip in your office!! When does the panic set in???
James,
there are lots of stats out there on sales volumes, but do you know of any that track actual average sale prices?
Grim — ditto Mike R.’s question. So many contracts are falling through these days that they seem to be a totally unreliable indicator of the real market. How many actual closings are there, month-to-month?
Or — are “Sales” equal to closed sales?
Grim,
Do we have the data back to 1998? It would be informative to see the trend/average over these 10 years.
007
Sales = Closed Sales
Contracts = Under Contract (I don’t net out BOM)
I only have data to 2000
jb
Grim,
Thanks. Would it be possible to have the data (from 2000) posted? Raw data is also okay.
Thanks,
007
Sure, just give me some time to put it together.
Overall is this data/format helpful?
Grim,
This is definitely helpful. I think this is a combination of three graphs that you ususally put out every month, namely: (1) monthly sales data which you just put out several dates ago, (2) activity, which can be generally/indirectly represented by the GMLS inventory number, and (3) most importantly, the contract, which give us a sense what the future sales data would be.
Thanks,
007
Updated with additional data.
jb
i know this is a bit of generalization, but it seems most of decline is coming from decreased sales and contracts in morris, somerset, sussex and warren counties (actually about 75% of the decline). doesn’t this seem to indicate that the bursting bubble, per se, is affecting the counties further away from NYC (as would make sense). Essentially, passaic, bergen and essex counties seem to be doing somewhat okay, although lagging as well.
Remember this is only a single month snapshot.
I’m not sure I’d make that same assumption based solely on this dataset. The monthly numbers can vary dramatically by county, simply due to the small sample size.
jb
grim:
Is there a trend?
Since there is no data on Middlesex county, what county does it most closely resemble?
Or is that too much extrapolation?!
https://njrereport.com/images/oct06-snapgraph.jpg
OT- Any chance someone can look up info on
2324991
2335709
2320231
Thanks!
JB-
Great data. I don’t care what Clot or any RE “expert” wants to say on this board. These are “the new reality” numbers.
JB, I’m not sure who, but someone keeps posting Bergen numbers from the mid-90’s and I find those as fascinating as well. Again, a small data set, but a view back into reality before the craziness.
Don’t know where this will lead us, but not good for builders, RE agents, or mortgage companies.
JM
HEY GRUBBERS OPEN YOUR EYES. OR MAYBE YOU SHOULDN’T IT’S BAD REALLY BAD.
AND GETTING WORSE!
WORRY!
Housing Massacre spring 2007
BOOOOOOOOOOOOOYAAAAAAAAAA
Bob
Just heard from some tradesmen (plumbers electricians ect) and things have slowed dramatically.
LEAN TIMES ARE HERE GRUBBERS.
GET USED TO IT.
BOOOOOOOOYAAAAAAAAAA
Bob
I know this is the housing market and not the stock market, but as any trader would know, volume precedes price. So this decline in sales volume is foretelling future price declines.
doesn’t this seem to indicate that the bursting bubble, per se, is affecting the counties further away from NYC
Itulip.com ran an article about the geographic anatomy of a housing bubble burst. They argue that the bubble begins in the cities and then expands into the suburbs and out into rural areas. The collapse then happens in reverse order. These data, if statistically significant, would seem to support this view.
http://www.itulip.com/housingpriceregionscascade.htm
The itulip article sounds logical, but not sure if it absolutely works in today’s market. Assuming Manhattan is the metro and everything else in 10 miles (Hoboken, Queens, Brooklyn, etc) are at the border… at least what I have observed is a downward trend that is more significant in Manhattan (I am just looking at 2BR condo apartments) then Hoboken or Brooklyn.
Anyone care to comment?
HSD-
It seems like pockets radiating out from NYC to me. Like certain neighborhoods that were “iffy” before the bubble and experienced a lift are now starting to feel the contraction. I don’t know if it’s perfect concentric circles like itulip uses. More like overlapping smaller circles, little circles within rings, etc.
I think RentininNJ is on to something though. If itulip is right, then Bergen, Essex and Pasaic should start to really decline in the spring.
JM
Hard Place Says:
“know this is the housing market and not the stock market, but as any trader would know, volume precedes price. So this decline in sales volume is foretelling future price declines.”
This is what I learned in my economic class as well. i.e. price is a factor of supply and demand. Not according to NAR, who claim supply can increase, sales can slow drastically but prices will keep going up indefinitely. Remember: “This time it is different !!”
An interesting quote about Inflation from this weeks Barrons journal.
“As to Inflation, computers, as the economists never tire of telling us, undeniably are cheaper than ever. The question is though: Have you ever tried eating a computer? Or living in a house made of computers? Or driving a computer to work? For, by contrast, the cost of shelter and food and fuel and lots of other stuff that is still quaintly considered by most of the citizenry as essential ingredients off the good life are awfully pricey and getting pricier
Nor should we forget, in taking the measure of the economy, that it rests on a very but tentative foundation, indeed: a giant but rapidly deflating housing bubble floating on a vast sea of debt”
That’s an interesting theory regarding the reverse cascade of prices from outside to the large cites. That may help explain why we’ve been seeing huge drops in Morris but not in high end Essex or other towns closer to the city.
Here is proof of housing price drop in my development…
A 4-bdrm, 3-bthrm house originally listed at $889…
Reduced to $849
Reduced again to $799
Reduced again today to $769
An exact model sold for $800 late summer of 2005. If this house sells for $760, that’s a 5% drop in overall housing prices already.
rentininnj…thanks for the link to itulip..interesting article.
my only concern would be what we take to be the metro area. on most other place in the US it’s pretty clear. but in ny, employment is so diverse (from manhattan to bklyn to jersey city to parsippany to white plains, etc.) that there might be mini-metro areas where this article makes sense too.
Grim,
Thanks a lot for your work.
007
Grim,
The xls link needs to be updated also.
Thanks,
007
I did update the link above..
jb
BC Bob (from #3)-
Don’t worry about my office. We shed our low performers back in March/April. When I start hearing excuses & all the usual lame BS, it’s out the door for you! I knew one of my competitors was recruiting these losers, and I didn’t even care. They all went to this guy, one by one, and now he’s choking on their lack of production.
We fielded a call from Barnes & Noble last Friday…a past employment verification on one of those agents. Looks like she’s gonna be moving into one of those fast-track clerk positions.
I’m really enjoying this. Our base crew here now averages 15+ years in the biz, so we’ll be there at the end of the carnage…but it’s oh, so fun to see the marginal, “quick buck” artists drop like flies. Serves ’em right. As always, I’m the first to agree with most here that if our practitioners charge a surgeon-like fee, we should deliver that kind of result.
check out this ad from fairfield county craigslist… this guy should be thrown in jail immediately, and then given remedial english lessons…
*************
Paying rent every month and realized that you have the same amount of money saved? Do you want to save more money?
The richest people in america makes money from real estate. Doesn’t that tell us something?
I can get you into a home with no money down and closing cost in the loan. Houses appreciate every day so even if your going to take 30 yrs to pay off your loan the value of the house will go up at least 20-30% in the next 10 yrs.
NO Green card work permit?? Now OK
Let’s get you your home!!!
Call NOW!
Walter Noda
Cornerstone Funding
646-417-1354
First time buyer :
2320231 1 barnes place dom 58 olp 389,000
2335709 52 fitzrandolph rd 15 dom
2324991 Rental ? 541 route 22
KL
rentinginNJ,
late on this one from europe. interesting article/link concerning the trends in and out of the city. if you combine this analysis with BBC’s popluation growth thru 2015 (see URL below) you might have a sense that the drops and growth will be more highly correlated in the future, as more and more of us live in, or border with, major cities.
great interactive map (SAS will love the asia forecasts)….
http://tinyurl.com/l9v4w
Hi Grim,
Thanks for the great work. The information on this blog is simply outstanding.
Please could you also add Middlesex county to your data sets also?
Cheers,
SB