
A few days ago I posted the September sales data and received some negative comments because that data is highly seasonal in nature. I agree with the criticism wholeheartedly, RE sales rates are indeed highly cyclical throughout the year, and it just so happens that some of the drop I reported is just simply due to the yearly cycle. However, I did have some other data that showed this September drop to be more drastic than drops in the last few years. I put out a call asking for more detailed sales data, and that call was answered by a local agent with access to that data. I was provided the raw sales numbers, by month, for 2003, 2004 and the first nine months of 2005. I received this data this morning and was assured that Septembers sales numbers were solid at this point (being that we were now 4 days into October). While there could be some change to the numbers past this point, it was not likely we’d see any kind of dramatic change. So, I plotted the data into a year over year graph for 2003-2005 to show that the September data did in fact represent a signifcant change.
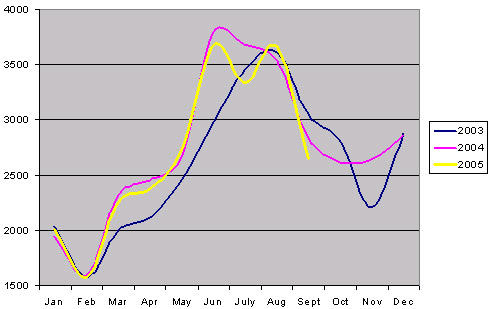 This data is for sales for Bergen, Essex, Hudson, Morris, Passaic, Somerset, Sussex, Union and Warren. Middlesex is not included.
As you can see, the September decline is steeper than the prior two years. I think this fits well with the anecdotal stories I’ve been hearing about slowdowns lately. Also quite curious is the double hump this year. It makes me wonder if June was actually the top with September being more of a dead-cat-bounce. Anyhow, I’m still going to say this is going to play out on the scale of years, not months, so I’ll continue to try to plot the data to try to accurately track the data. I’m never one to not throw out some opinion and guesses, so I’ll leave you with just one. I predict that NNJ February sales this year will be the lowest we’ve seen in many years. This winter is going to bite into many new and in-debt homeowners sharply. Keep an eye on your utility bills as the weather starts to turn, we’re likely to see something on the order of a 25% increase in utility bills. Combine that with the increase in credit card minimums (2%-4%), increased gas prices, continuing increases in interest rates, etc.
Caveat Emptor,
grim
I agree with you regarding the “dead cat bounce”. I see rapid decline in real estate sales in NNJ in a near future.
Watch out for the 10/17 New Bankruptcy Law being enacted.
Prices are going to just collapse quickly. Not the slow drip drip price decline. It is different this time. Leverage has been abused and not it will unwind as escalating housing costs soar. Property taxes, utility and gas.
Look what happened in Japan. It may just happen here. I hope it doesn’t get this bad.
http://www.rbcpa.com/japanlandprices1980through2002.jpg
Prices will drop only as fast as buyer psychology changes, not faster. The real issue is that there are many people that would view a temporary decline as a buying opportunity. We’ll likely see many bounces on the way down.
My vote is still long and painful.. The fed doesn’t look like it’s going to stop raising rates any time soon.. So we’re likely to see 4.25 by December, and rate hikes from there on out. Where they stop, nobody knows.
I also agree that this winter will not be a fun time for recent highly leveraged buyers. Especially those on a very tight budget. Utility bills are likely going to be a shock for new owners this winter. If that’s not bad enough, the remaining credit card companies will finish pushing minimums to 4%. If you thought the savings rate was bad the last three months, don’t expect the next few months to be any better..
The last piece to this puzzle is when ARMs start to come due in the next few years. If mortgage rates rise rapidly, and sales stagnate as they are already starting to, many ARM holders are going to find themselves under water. This is the biggest factor (in my mind) in the length of the decline..
jb
The first wave down is the quickest and farthest.
In the early 1990’s internet was not around for mainstream and 24hr news just coming into its own. Information is spread much more quickly today than in the past.
The bubble is popping right now. Just don’t expect a realtor to let you in on the secret b/c many of them probably are also flipping homes so they are going to be desperate soon.
Prices any way you look at them are totally out of wack rents to home price, prices to income. Normally houses sold at 3-3.5 tmes annual incomes now we are at 6-8 times incomes.I know my parents and other older folks I have spoken to paid more like 2-2.5 times income. This is all a result of easy lax lending standards in combination with creative exotic new loans. It all does not compute and this will not follow past corrections in my opinion. The debt is so great today versus 15 years ago. US economy Debt to gdp is over 300% the only time period close to this was in the 1930’s depression era.
Anonymous said,
“Prices any way you look at them are totally out of wack rents to home price, prices to income. Normally houses sold at 3-3.5 tmes annual incomes now we are at 6-8 times incomes.I know my parents and other older folks I have spoken to paid more like 2-2.5 times income. ”
I thought the price of house/apartment was 15 times the annual income.
For example, if the rent on the unit is $2000, the annual income is $24,000. Then the price of the unit should be around $360K — I believe this is based upon 6% average return on your investment.
I said annual incomes not annual rents. Rents usually about 12-15 times annual rents in solid markets near under 10 in so so markets.
Right now this area is about 22-25 times annual rents. does not make any sense. or about 30-40% overvalued on this measurement.
Lots of new Real estate moguls running around like a bunch of idiots buying homes with risky loans and at uneconomic levels. Someone has to lose and it will be these fools.
In early mid 1970’s some people were buying houses like 4 bedroom ranches in central nj at about $50’ish.
Income for this one individual was about $24-25k a year so a little over 2 times income. It was very tough to get credit back then. Many paid cash for cars or put down 20-30% when buying house.
Today any fool that can sign their name can get credit. It is a society of monthly payments that has gone to far. Excesses all are over this economy in terms of leverage.
It’s kind of like the S&P 500 which averagednearly 20% yearly return for 20 years thru 1999 but since has lost a ton. The S&P is still off about 20% from the top but at the depths of the correction down nearly 50%.
Expect big correction in housing also. Incomes are just not high enough to justify the current insane prices.
But idiots keep buying with risky loans. This is ending and rational minds willprevail.
As others have said, this is a psychology game, run by fear. The market went up with fear of missing out. It will go down for the myriad of fears that are now coming to a head.
The rapid changes in the market are being reported in mainstream media, with buyers, sellers, and the housing industry itself already reacting.
Someone making $24,000 cannot afford a $360,000 house unless they put down 70%.
All markets are based on psychology. Why do you thin a 1969 mach I mustang that went for about $35k 3 years ago recently sold for about $90k.
Greed and fear play big role in society.
All one has to do is take a step back look at history and normal valuations to see the housing market is completely bonkers.
Wall Street bonuses will not necesarily be 10% higher than last year. A fair amount depends on how the rest of the year goes.
Also, while some areas (M&A, Commodities) have done very well, other areas have been just OK.
Bonuses may be up overall from last year, but its far from guaranteed.
Incidentally, Wall Street really doesn’t make much money from personal debt.
Got this from Craig’s list for Sacramento/CA region. Look into gsmls for Somerset/Hunterdon counties and you see similar trends.
If this speeds up a lot of buyers will hesistate to buy for fear of being under.
———————————
Well, I have debated posting this as I probably know the debate and name-calling that will begin. Here goes anyways. I have been watching various neighborhoods in the Sacramento area and have been able to find instance after instance of prices being dropped to 5-10% below firm comps (Same model within 1 mile and similar upgrades and features). Give me a zip code in the greater Sacramento area and I can find the same thing. The really sticky part is that the prices have been lowered to 5-10% below…but are STILL ACTIVE. No pending offers even when prices are 10% below last similar house sold. Furthermore, these are all the starter homes. The upper end looks similar. I will post a couple of these that I have found. I would think this was anecdotal, but I can find it in pretty much all zip codes. It seems to transcend both very expensive neighborhoods, middle class neighborhoods, and very poor neighborhoods. Also, starter homes seem to be effected as much as move-up homes.
95757
1330 sq ft 3/2. Five have sold since July at $400k, $404k, $396k, $400k, and $408k (Sorted by sales dates). There are 5 listed for $379k 32 DOM, $384k (with 7k offered back) 88 DOM, $395k, $399k, and $400k. None of this model is pending. If you take off 7k from the asking price of $384k that’s an asking price of $377k, or $51k (12.5%) cheaper than the highest comp. MLS #s 50081629, 50056271, 50089400, 50081652, 50074291.
95826
1337 sq ft 3/2. Two with pools sold for $363k and $359 in April. Two more without pools sold in April and June for $345k and $347k. Three Active, none pending at $330k (43 DOM), $339k (69 DOM), and $357k (36 DOM). MLS #s 50076514, 50066502, 50079003.
95843
1206 sq ft 3/2. Four sales since April all of the same floor plan within .4 of a mile. No Pools, similar features. Sales price in order of Sales date are 332k, 340k, 346k, 335k. 3 Active, none pending at $299k (3 DOM), 317k (86 DOM), and 335k (15 DOM). That’s a $46k (13%) lower asking price than one that sold on July 28th. MLS #s 50093209, 50058855, 50088837.
95765
1246 sq ft 3/2. Three sales since April all same sq footage, no pools. $384k, $380k, and $400k respectively. Three Active, none are pending at $370k (41 DOM), 389k (116 DOM), and 408 k (22 DOM). MLS #’s 50077478, 50048132, 50084986.
Numbers are getting ugly already.
Grim:
I got this link from Ben’s HB blog.
https://www.melissadata.com/ssl/homesales.asp
This gives the houses sold by month / zip code and average price. Any one volunteer to plot central/N NJ counties? The data goes all the way back to 2000.
I took a look at the Melissadata site. I’d have to write up some sort of script to go out and gather the data. There are just way too many zip codes that need to be aggregated to be useful.
Sales at the zip level are incredibly volatile, it’s not until you begin to aggregate data over a larger area that consistent (and useful) patterns emerge.
I’ll see if I can code something up quickly to pull back 50 or so zipcodes worth of data. I did it manually for 10 zip codes and the YOY patterns are very similar.
-grim
This is what Federal Reserve Governor Pool said in a speech last night.
“However, if a housing finance agency were to fail, the scale of these agencies is so immense that it would certainly pose risks to the broader financial system.”
“We need to have a clear and unambiguous receivership relationship,” he said, referring to an orderly way to wind down and liquidate assets if insolvency were to happen. Fannie and Freddie aren’t allowed by law to declare bankruptcy. “If there was a solvency problem, it would all end up in the courts,” he said.
Why would he even bring this topic up?
Paul Volcker warning on asset bubbles A Must read.
http://www.washingtonpost.com/ac2/wp-dyn/A38725-2005Apr8?language=printer
Hi,
I found reading your blog interesting and well done, I do like what you have done with your site but it is not really the information I was after about income opportunities . Keep up the good work and hopefully I will visit again sometime and also find the information on income opportunities that I was looking for in my travels.
Regards,