
I’ve finished gathering the December 2005 Residential Home Sales Data (from GSMLS). This data is ours, gathered by my team. As soon as the prior months statistics are available, we gather that data and compare it, YOY, with the 2003 and 2004 sales data to determine trends within the current real estate market.
I believe this to be the most up-to-date indicator available for the Northern New Jersey market. Why? Because anything else either lags the market by many months, or aggregates data into quarters.
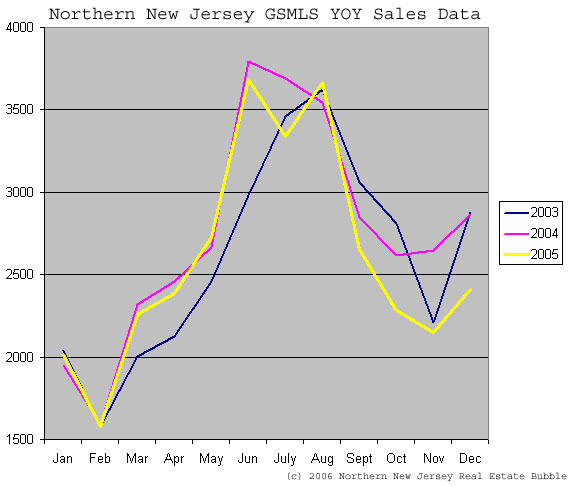
The data shows what we’ve been seeing and hearing anecdotally for Northern NJ. While December sales did increase over November as usual, sales were significantly below what was seen in 2003 and 2004.
 This data is not seasonally adjusted and consists of sales of GSMLS listed properties in Bergen, Essex, Hudson, Morris, Passaic, Somerset, Sussex, Union, and Warren counties. This data does not include sales from other listing services (NJMLS or Hudson MLS) nor does it contain FSBO sales. However, GSMLS is the largest MLS service in Northern NJ, thus we’re confident that the data provided is representative of the market.
December 2005 sales were approximately 15% lower than both December 2003 and 2004, in line with anecdotal evidence as well as the NAR Pending Home Sales Index data posted for November.
While demand is still following typical seasonal patterns the trend is unmistakably downwards. The cooling of the Northern NJ market should be fairly obvious at this point. Waining demand isn’t due to seasonal factors, it’s due to significant changes in consumer psychology. I can’t see how there will be any soft landing for Northern NJ.
Caveat Emptor!
Grim
If not a secret, how do you obtain the sales data from gsmls?
Grim:
Just off-hand, do you recall what occurred in Nov 2003 to cause that blip? Was that a Sep/Oct 2003 event?
Not a secret at all, I’ve mentioned it in the past actually. I have a ‘team’ of local real estate agents that provide me the data directly.
I am not an ‘insider’. In the past I mentioned that I was planning on getting a real estate license and setting up a corporation in order to gain direct access to the data. I’m still planning on it, but haven’t seem to have found the time to go through with it (or justify the money it will cost me).
grim
chicago,
Not entirely sure, I’ve been trying to go back through news articles to understand. I did some minor investigation when I first plotted the data but never dug deep.
The best I could find is that in August and September 2003 mortgage rates spiked very high.
HSH Mortgage Statistics 2003
Since the data represents closed sales, it’s possible that the rate spike in August and September significantly deterred new buyers from signing contracts in that time period. The significant drop in rates shortly thereafter can possibly explain the dramatic rebound seen a month later (6.47% in August on the 30Y Fixed to 6.07% in November on the same paper).
grim
As long as you don’t have to sell, none of this is all that bad. Frankly, the market needs to catch its breath. And for every seller that takes a hit, someone entering the market gets a break.
The economy is strong and with the U.S. population about to hit 300 million and not stopping there, the overall trend will be up, up up.
That said, it may take a few years for prices to come back after a fall. A 30% fall means a $100,000 house sells for $70,000, but to get back to $100,000 from $70,000 requires a 43% increase.
The market may collapse and then lay dormant for 4-5 years. And then, in perhaps only a matter of months, prices will surge something like 30-40%.
All we have happening now is the train is slowing down to pick up new passengers.
Sir you are dreaming.
Ever take a look at the typical bubble aftermath. It took Japan 13 years to bottom. And finally it’s going up but when your down 60% on a $200,000 house or $80,0000 value 50% increase only takers you to $120,000. Sounds real scvary doesn’t it. But this is reality at some pojnt and there are risks to owining a house.
IMO any baby boomer that purchased in the last few years will be lucky just to breakeven by retirement, if they can even retire because most are living way beyond income capaicty and not saving. The housing ATM isn’t going to bail them out in retirement.
when you say “Northern NJ” but get your information from the GSMLS, you are missing some key information regarding Northern NJ home sales.The Hudson County MLS accounts for a large portion of “Northern NJ” housing and information from this service really should be taken into account in your recaps and conclusions regarding the bubble.
here’s empirical evidence of the days on market (DOM) scam perpetuated by the real estate industry to cook the numbers. note the 2 URL’s below. the first one shows the original listing date of 9/23/2005. it was taken off the market (Status = T). it was relisted on 1/4/2006 at the same price. when it sells, the DOM will be missing the 60+ days from the original listing.
don’t believe the numbers folks. there are many ways to cook em.
original listing:
http://listings.gsmls.com/SearchDetail/Scripts/PrtBuyFul/PrtBuyFul.asp?prp=Mls&MlsNumList=2110947
new listing:
http://listings.gsmls.com/SearchDetail/Scripts/PrtBuyFul/PrtBuyFul.asp?prp=Mls&MlsNumList=2231096
Since it sounds like you are an ‘insider’, would you like to provide me with that information? Are you an agent in Hudson?
Current Hudson County listings via MLSGuide are currently approximately 1700 (single family, condo, and coop only). The seasonal drop we’ve seen puts todays numbers back to where we were in late October. Current GSMLS listings are over 11000.
I really don’t believe the addition of Hudson county data would make a significant impact on the trends we’re seeing. If I plot the data I have for each individual county, the trend is largely the same, which leads me to believe that the current trends are not confined to smaller markets, but does indeed describe all of “Northern NJ”.
grim
Anonymous said, “Japan’s real estate market took 13 years to bottom out”. In japanese culture, it is uncommon to sell the house you live in. Once you buy a house, you stay. That is probably why it took 13 years. It is different story here in U.S. at least for residential market.
Here’s what I don’t get:
As I previously stated, we’ll be looking to buy in Aug, when our rental lease is up.
If prices are already being reduced by around 30k-50k, whose to say a 500k house NOW won’t be on the market for 400k IN AUGUST?
Add in the fact that some people will be NEEDing to sell their place for whatever reason (can’t afford it, need to downsize, job, etc, etc).
And I agree: If you are buying your house to LIVE in it, you shoudl be OK. If we buy a place for 375k in Aug, there’s a chance it could drop another 25k in value by the end of the year.
Let’s say we live there 10 years. Why couldn’t the house by worth 500k then?
For now, the days of flipping are over. If you’re looking to buy and live in a place WITHOUT an IO or ARM loan, I don’t see the problem.
Landgrab,
It would be wise for you to include an adjustment for inflation as part of your calculations. If you purchase a home today for $500,000 and in 10 years you find it worth $500,000, you’ve lost a significant amount of money.
Compare that to someone who waited. Perhaps they purchased the same home for $375,000, 25% less than you did. When ten years pass they may not have made a fortune, but they’ve at least hedged against inflation and didn’t lose money.
Many people need to sell their homes, however, absolutely no one needs to buy a home.
Landgrab, I think come August you may find that your outlook has changed dramatically.
Caveat Emptor!
grim
” In japanese culture, it is uncommon to sell the house you live in. Once you buy a house, you stay. That is probably why it took 13 years. It is different story here in U.S. at least for residential market. ”
-if the US housing market had similar declines of 60% in value it will become just as unusual to sell the house you live in regardless of our culture….because just like in Japan most wouldn’t be able to….Who would be in a position to cover a 100 to 300k loss?
Thank you for the most accurate picture of what is going on in a given real estate market that I have come across.
It’s been difficult to quantify the perception of a slowing market because three years of data has been hard to come by as so many real estate watchers (including me) have come to the game only recently.
Your data backs up the sentiment being expressed nationally and I believe translates well to my neighboring local (the Jersey Shore).
BTW, I should track the sources, but you might consider a post on experts’ speculation for 2006, Just from memory, Lereah 5-6% down, Freddie Mac 6-8% down, MBA a 30 percent decline in mortgage activity ($3 trillion to $2.1 trillion). If they’re overly optimistic as their natural prejudice tends to be, 2006 could be a very ugly year.
re. the question “who can cover a 100-300k loss?” Let’s remember, a lot of those fine folks who are trying to sell for 750 bought their houses 10 years ago for 250. the price could drop to 350 and they’d be fine, just not magically wealthy off of an overappreciated market.
What in the world is the world…Some people believe that to create is great but build is like changing the past forever… If you want to create a beautiful home Visit building contractor and you can see what a little change can create..