
Rick and team at RealtyTrac were kind enough to provide us with the foreclosure data on a county level for Northern New Jersey. A big thanks to RealtyTrac for going out of their way to get this for us. Please take the time to visit their site if you are interested in learning more about foreclosures.
Click to enlarge
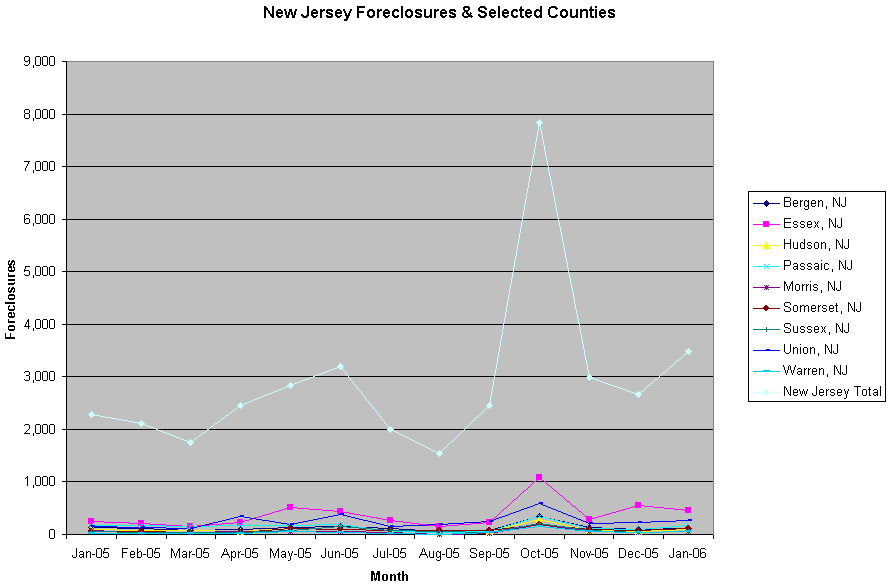
I had asked the folks at RealtyTrac if they could prove me with county data on a month-by-month basis for the past year in order to determine if there was any obvious trend developing. While there seems to be a slight overall rise for the year, it is likely too premature to judge. The spike in October is a bit concerning, however it may likely have something to do with the bankrupcy laws that went into effect that month. I’ll be keeping close tabs on the foreclosure numbers in the upcoming months.
If anyone has any more questions about the data or foreclosures, just post them up and I’ll see if I can get someone from RealtyTrac to answer.
Caveat Emptor!
Grim
It looks like the other 12 counties are in worse shape! The bulk of NJ’s Population falls within NNJ yet it appears that they are underrepresented among the foreclosures.
wait till property taxes go up, because of the trenton short fall.
you aint seen nothing yet.
and layer on top ,, the refi’s caused by the adjustables
Bergen, Essex, Hudson, Passaic, Morris, Somerset, Sussex, Union, and Warren counties constitute roughly 40-45% of the total NJ foreclosures.
For January ’06 the 9 county total was 1,416, the New Jersey total was 3,474
For 2004, the 9 county total was 14,678, the New Jersey total was 34,103
Essex takes the lead in raw count with 4,352 in 2005 (1.446% of households in foreclosure).
Sussex takes the lead in household percentage with 1.601% of households in foreclosure in 2005.
Looking at Jan 05 versus Jan 06
County/Jan 05/Jan 06
Bergen/131/123
Essex/252/458
Hudson/102/92
Passaic/164/179
Morris/67/53
Somerset/61/118
Sussex/66/61
Union/143/267
Warren/22/65
grim
i expect 2006 to end with a whimper and 2007 to accelerate the competitive reductions on overpriced properties. it’s just far too soon IMO for the wheels to come off this year. rattle a little yes, but sellers and others are still drinking the koolaid.
just this week a woman i work with who lives in Madison in a 3 BR cape tells me she’s going to add a second level to her house. she calculates after the upgrade her property will be worth $850k. i’m thinking to myself, where the heck did you get that number? similar properties in her area go for no more than $600k and that’s in a peak market. people have gotten so euphoric on real estate it’s messing with their sensibilities. if this market just stagnates there’s going to be alot of hurt.
Big day tomorrow on the data front..
Building Permits
CPI
Housing Starts
Initial Claims
Philly Fed
grim
Most of my foreclosure calls come from Essex and portions of Morris Co. Although NNJ sees a lot of foreclosure filings, they end up selling them at market and never going to the Sheriff Sale.
Just wait, once the banks become deluged with foreclosures and actual repossessions then all you guys can pick up nice properties for cheap.
Tom
“D”igital Breakfast
estimated $2 trillion will adjust
in 2006 and 07. $600 Billion of
subprime loans were originated in
2005,,, up from $150 billion in
2000. It has to effect the industry
Grim,
In the 2000 census the 9 NNJ counties represented 51.25% of the state population. As was pointed out Essex takes the lions share.
interesting that there was a spike last October. That’s when the new bankruptcy law went into effect. Nationwide, there was a spike of personal bankruptcy filings around that time to try to get in before the new law took effect. I wonder if it would be possible to get statewide bankruptcy filings for last year to see if in fact there is a correlation
…It looks like the other 12 counties are in worse shape! The bulk of NJ’s Population falls within NNJ yet it appears that they are underrepresented among the foreclosures.
Homes have appreciated faster and more markedly in NNJ. Also, homes in NNJ are much more liquid and therefore easier to unload. This gives “homeowners” (and I use the term loosely) more options to avoid foreclosure, which is the last resort.
This pattern seems to mimic the national trend. For example, Georgia, Texas, Oklahoma and Tennessee are in the top 10 for the highest foreclosure rate in the U.S. Massachusetts, Rode Island and Washington DC are on the Bottom of the list.
This will change quickly if home prices in hot areas begin to slip or even stagnate.
are the RealtyTrac links broken?
Yes, the RealtyTrac links were broken. They’ve been fixed now.
This blog is quickly outgrowing Blogger.
grim
Grim,
This is from the MSN RE site. My access is blocked but this is the gist. (got this from planetizen.com)
A new study shows that the number of households entering some stage of foreclosure is up 45% over this time last year — one for every 1,117 U.S. households.
“The number of foreclosures is still low on a historical basis, but it has been rising steadily over the past year, RealtyTrac reported. Job losses in some regions were to blame, but so, too, were risky borrowing practices that left homeowners little wiggle room on their mortgage payments. And with the pace of appreciation stalling and interest rates rising, many economists and industry observers expect the pace of foreclosures to accelerate this year.”
“In the last few years, many buyers took out interest-only, variable-rate loans, and in some cases put no money down to afford a house, said Frank Nothaft, chief economist with government-chartered mortgage giant Freddie Mac. He estimates one out of every three loans issued in 2005 was an adjustable rate mortgage. Now that we’ve seen 14 consecutive interest-rate increases since June 30, 2004, many of these loan rates are bumping up, increasing the size of mortgage payments.”
Source: MSN Real Estate, Mar 14, 2006
Full Story: More Americans are losing their homes