
OCTOBER SALES TREND HIGHER
The New Jersey housing market improved in October as home buyers took advantage of recent declines in home prices and lower mortgage rates. In October, contract-sales jumped 10% after being down by 20% through the first 9 months of 2006. That this improvement occurred at a time when seasonal trends traditionally bring a decline in purchase activity is significant. Also, the number of unsold homes on the market declined by more than 4,300 houses in October, reflecting a 6.4% decline overall from the September inventory level.
According to Freddie Mac’s Primary Mortgage Market Survey® (PMMS®), the 30-year fixed-rate mortgage (FRM) averaged 6.14 percent for the week ending November 30, 2006, which is lower than the 6.26 percent rate of one year ago. Also contributing to the October sales performance was continued job creation with more people now working in New Jersey than at any time in history, falling energy prices which affect both home heating and commuting costs, and rising wages resulting from the tight employment market.
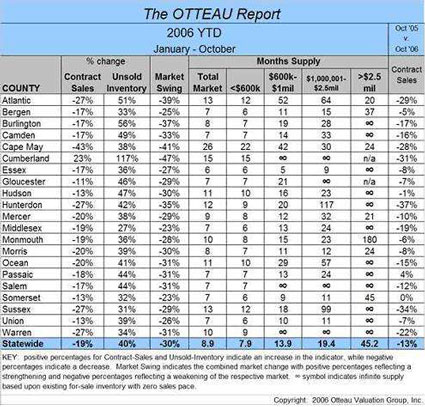
A closer look at Unsold Inventory indicates an overall supply of 8.9 months, down from 10.4 months in September. One year ago, Unsold Inventory reflected a 5.5 month supply. When analyzed by home price, the market continues to show the greatest strength below $600,000 with a 7.9 month supply as compared to 19.4 months above $1 million and 45.2 months above $2.5 million (see table at right).
The improvement in the housing market is a direct result of the gain in housing affordability outlined above and makes a strong argument that the current housing slump is more correction than crash. Housing affordability suffered greatly from 2000 to 2005 during which time salaries in New Jersey rose only 16% as compared to an 87% increase in home prices. Given the recent gains in housing affordability outlined above it appears that the market may be approaching the balance point at which recovery will begin. Look for first-time buyers purchasing starter-homes to be the first segment to recover, following which the recovery will spread to the other market segments. However, the current sensitivity to both home pricing and housing affordability will prevail well into the recovery cycle ensuring that home prices will remain relatively flat once the decline subsides. Therefore, Right-Pricing! will remain essential to successful home marketing well into 2008.
Sorry Jeff, but I strongly disagree both your outlook and your terminology.
Contract sales are still down from last October. I agree that the downward trend is decreasing, however it is still negative. Your table above shows contract sales down 13% statewide, with the best performance being a 0% year over year change in Somerset.
While the downward trend is leveling to slightly negative, remember that we’re now compounding year over year over year sales volume losses.
Looking at my own October data, from GSMLS only, I’m seeing a change very similar to what Otteau is reporting on a statewide level:
https://njrereport.com/images/oct06-snapshot.gif
https://njrereport.com/images/oct06-snapgraph.jpg
Seasonal varation in the NJ market is significant, so month to month comparisons are difficult to make, even with seasonal adjustments.
https://njrereport.com/images/oct06a.gif
Also, the number of unsold homes on the market declined by more than 4,300 houses in October, reflecting a 6.4% decline overall from the September inventory level.
As far as the declining inventory, isn’t that just seasonal variation? Normal for this time of year?
https://njrereport.com/images/inventory0405.gif
Now, forgive me for extrapolating numbers from the graph, but I don’t have the actual numbers. For 2004, it appears that inventory declined 2,500 homes from September to October, a loss of 6.7%. It appears that in 2005, there was also a loss of 2500 homes over that same time period a loss of approximately 5.5%.
While the inventory fell a larger number of units this year, the percentage change is inline with what we’ve seen over the past two years.
Caveat Emptor!
jb
Ouch! Dead Cat bounce, right?
“…current housing slump is more correction than crash. Housing affordability suffered greatly from 2000 to 2005 during which time salaries in New Jersey rose only 16% as compared to an 87% increase in home prices.”
How could an honest analyst write those sentences in a row? While their data may be sound, I do not take Otteau’s forecasts seriously.
Unfortunately, I’m on my way to class this morning.
I’ll try to provide more data later in the day.
jb
“That this improvement occurred at a time when seasonal trends traditionally bring a decline in purchase activity is significant”
i know i remember seeing on this site a graph that depicted that there has been over the past several years a spike right about now before it would go down. If i remember commenting then how the NAR ad seemed to be timed just for this season.
“According to Freddie Mac’s Primary Mortgage Market Survey® (PMMS®), the 30-year fixed-rate mortgage (FRM) averaged 6.14 percent for the week ending November 30, 2006, which is lower than the 6.26 percent rate of one year ago. Also contributing to the October sales performance was continued job creation with more people now working in New Jersey than at any time in history, falling energy prices which affect both home heating and commuting costs, and rising wages resulting from the tight employment market.”
housing is affordable because in the last 1 year
1] mortgage rates dropped from 6.26% to 6.14%. On a 400K mortgage, the saving is $30 a month!!!
2] Oil actually went up from ( Dec 1 2005 – Dec 1 2006) $60 to $63( -$3)
3] Net jobs in NJ (Civilian Labor Force) increased (Oct 05-Oct 06) from 4456.5K to 4472.2K = 15K. 15K for an economy of this size??
4] Unemployment in NJ Oct 05-oct 06 = 195.5K – 195.7K = -0.2K. Total unemployed actually went up.
5] Hourly wages increased by $1.94.
http://www.wnjpin.net/OneStopCareerCenter/LaborMarketInformation/lmi16/tablea.htm
RE is finally affordable!!
OK all of you now go back and use your $1.94/hr wage increase to buy the next 500K property that you come across.
wait…before you go on a shopping spree with your $1.94/hr wage increase..
Jeff seems to have conveniently ignored some facts about NJ economy
1] Weekly hours fell from 37.7 to 35.6. On an average everyone is working 2 hours less. Which results in 1.72/hr wage loss.
2]Weekly wages edged up by $4 a week from Oct 2005 ($208 a year). (Jeff, that’s a big increase!!!)
You now have $156 ($208 after 25% tax) saved over the last one year to buy your 500K house.
Hourly wage used for calculation is of type ‘information’ which comes up to $32.61/hr.
I completely ignored manufacturing hourly wages which is like $16 an hour. Adding manufacturing wages to the mix will make wage gain look worse.
I forgot to add inflation to the mix. Real wage increase is actually negative.
“One year ago, Unsold Inventory reflected a 5.5 month supply.”
That means that current inventory is 60% higher as compared to last year. At current stage, I would agree, it is now a correction. What does 2007-08 bring???
V,
I was about to make a statement regarding the affordability theme. I can’t say it any better than you already have.
Watch the inventory just balloon come January. The rush will be on to get listed early.
Whew! Thank God this housing bubble thing is behind us. Now we can get back to normal price appreciation and noticeably “brisk” housing sales, right?
I just realized how many infinity signs there were on that chart..
jb