From NJ Business Magazine:
NJBIA’s 62nd Annual Business Outlook Survey
In last year’s Business Outlook Survey, most respondents said they were anticipating an economic downturn.
But no one saw this coming in their 2020 vision.
The onset of the COVID-19 pandemic resulted in an economic meltdown, with unforeseen closures of operations and record unemployment, to say nothing of consumer confidence as masked shoppers treaded lightly throughout the nation.
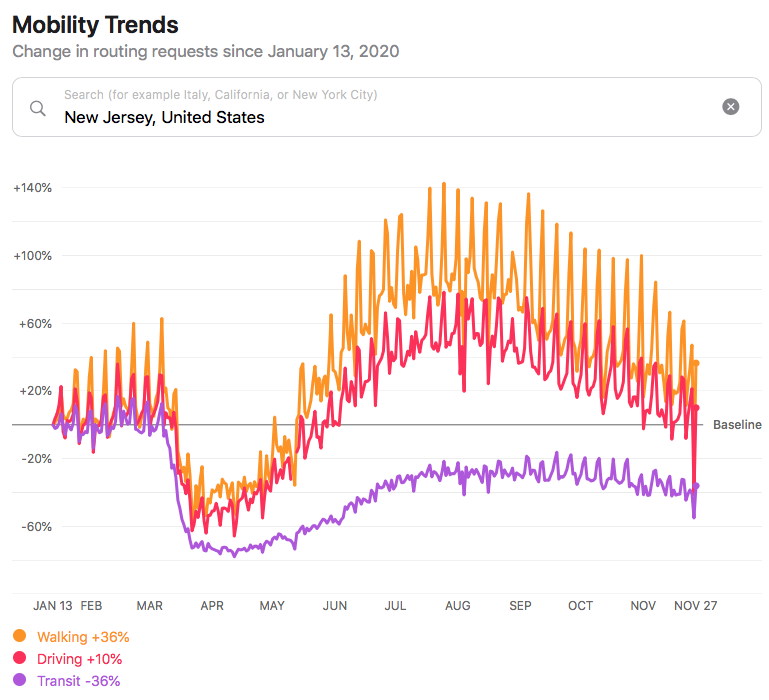
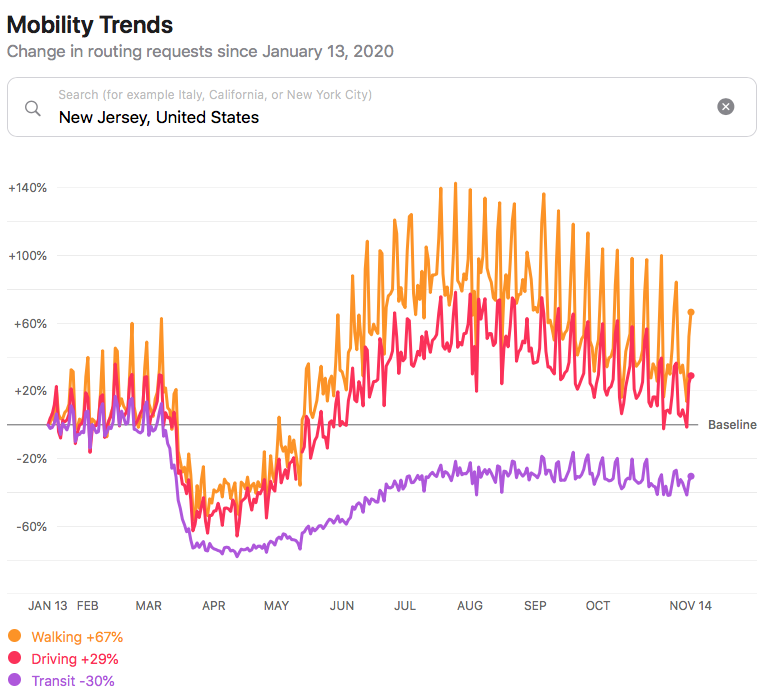
Nowhere has this been more felt than in New Jersey, the state that maintained its shutdown for the longest period and has been a national outlier in terms of pace of reopening and capacity levels.
Many of the results of NJBIA’s 2021 Business Outlook Survey are what you might expect for such a devastating plunge of New Jersey’s economy. Revenue losses were severe, with a whopping 76% of respondents experiencing decreased earnings through the first eight months of 2020 – including some deeper losses in healthcare and transportation.
Moreover, 77% said they believe they will continue to incur losses as the survey was being fielded in September – with 27% saying they would continue to lose revenue through the rest of 2020 and 33% forecasting continued losses through the first half of 2021.
There certainly was no shortage of efforts by employers to right the ship during the stormy seas of 2020. Some 56% said they sought additional or alternative funding sources through federal and state loans and grants, while 59% reduced expenses and overhead. Among those decreased expenses were reduced salaries (20%), furloughed employees (22%), and laid-off workers (23%).
Recovery-wise, 47% said they will either take more than a year, or never will, generate profits lost during non-essential business closures.
And, looking ahead to 2021, healthcare coverage could certainly be impacted as a result of this reduced revenue. Out of the 72% of respondents who offered health insurance in 2020, 28% of them said they’ll discontinue that coverage in 2021.
Concerns about increasing the minimum wage and the potential legal impacts of recreational cannabis were also raised, as in years past. But with the onset of the coronavirus, a new worry has emerged in the form of litigation brought by those who claim they contracted the disease while at the workplace.
With all of this, there was the expected negative outlook for New Jersey’s economy in 2021, particularly compared to the forecast for the national economy.