From the NY Times:
Housing Affordability Improves
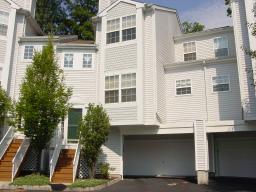
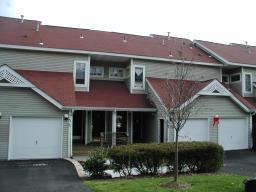
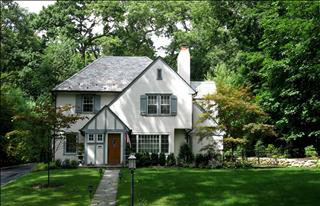
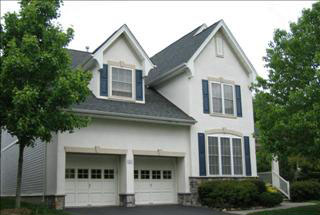
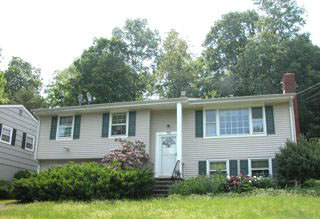
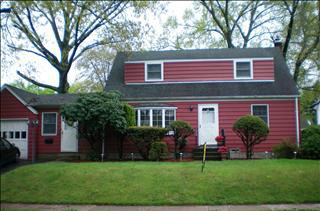
TRADITIONALLY, there is happy news about the residential market in springtime — always its busiest season. Here is this year’s bulletin: Home prices have declined so much in the state that average buyers can actually afford to buy houses (if they can get a mortgages, of course).
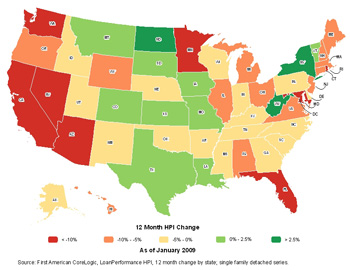
Also, as of the latest statewide report from the Otteau Valuation Group, there were six towns with less than six months’ worth of unsold inventory. (But there were also six others with enough houses on the market that it would take 99 months — more than eight years — to sell them all at the current pace.)
These tidings may seem underwhelming in their gladness, but they are the most salutary available as prices continue to slide and the inventory of houses for sale blips upward this season, according to the market trend analyst Jeffrey G. Otteau.
House prices right now are descending at the rate of about a percentage point a month, according to Mr. Otteau, whose company is based in New Brunswick. At seminars that he conducted for brokers in March, Mr. Otteau predicted an additional nine point drop in prices by the end of the year, and no likely upturn until 2010.
…
Back in 2000, the index was pegged at 122 percent, meaning a buyer with the median income earned 22 percent more than needed to own and maintain the median-priced home. This assumes that housing costs 30 percent of income, which is a standard assumption, Mr. Otteau explained in a recent telephone interview.By 2005, when housing prices were reaching their peak, the median buyer could afford only 92 percent of the cost of owning the median home, he said, and by 2006, it was only 81 percent.
In 2007, when prices fell, “affordability” was back up to 87 percent, and by June 2008, housing was again 100 percent “affordable,” under the formula.
Now, Mr. Otteau said, the market has “overcorrected,” and this will continue. The index is 107 percent and rising.
He also suggested that towns that have commuter rail stations — Montclair, for instance, has three — continue to be in the best position to attract buyers, once the economy improves and the New York metropolitan area stops “leaking jobs.”
…
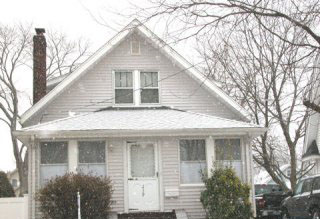
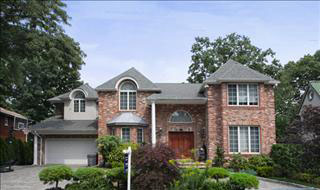
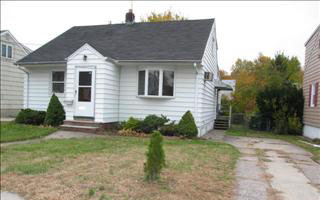
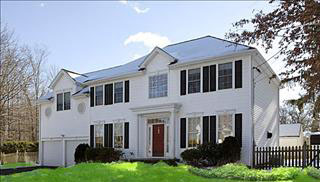
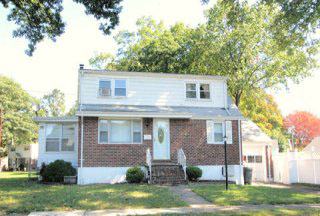
ased on the most recent Otteau market report, the six communities in the state with the shortest time frames to sell their inventories — and therefore the healthiest markets — were Midland Park, Fanwood, Dumont, Boonton, Hanover and New Providence. Of those towns, all but Dumont and Hanover have train stations.The six communities with the 99-month inventories are Alpine, Garfield, Oradell, Avalon, Lavalette and Seaside Heights. They are among the most affluent communities in New Jersey, the nation’s second-wealthiest state, Mr. Otteau noted. “This is understandable,” he added, “because homes that are less affordable, those priced above $1 million, are the ones sitting on the market the longest.”
Statewide, there is a 42-month inventory of homes priced above $1 million; for listings at $2 million or more, there is an 84-month (seven-year) supply, he said.